

Question: 1. Compute the MSE and MAD for each forecast. Does either forecast seem superior? (Round your answers to 2 decimal places.) 2. Compute MAPE for
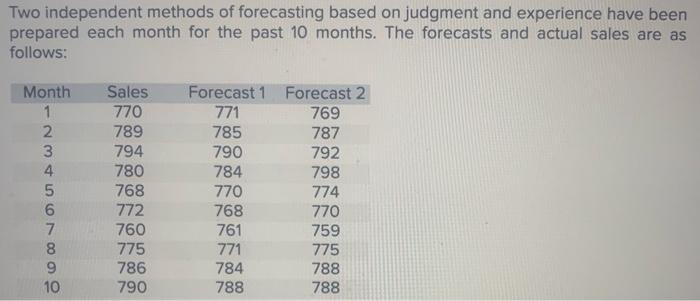
1. Compute the MSE and MAD for each forecast. Does either forecast seem superior? (Round your answers to 2 decimal places.)
2. Compute MAPE for each forecast. (Round your intermediate calculations to 6 decimal places and final answers to 4 decimal places.)
3. Prepare a naive forecast for periods 2 through 11 using the given sales data. Compute each of the following; (1) MSE, (2) MAD, (3) tracking signal at month 10, and (4) 2s control limits. (Round your intermediate calculations and final answers to 2 decimal places.)
Step by Step Solution
There are 3 Steps involved in it
1 Expert Approved Answer
Step: 1 Unlock

Question Has Been Solved by an Expert!
Get step-by-step solutions from verified subject matter experts
Step: 2 Unlock
Step: 3 Unlock