

Question: 1. Computing labour productivity and its relationship to the demandfor labour Gopher Excavators produces shovels in a small factory and sells the shovels in
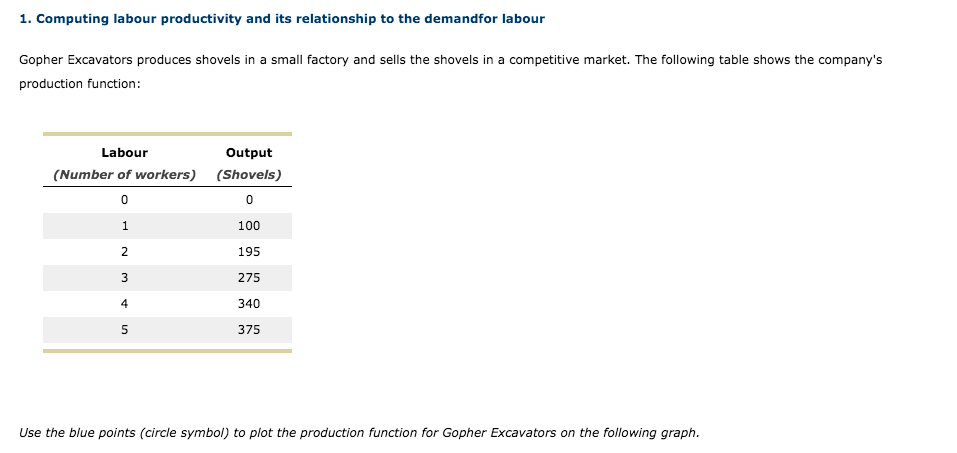
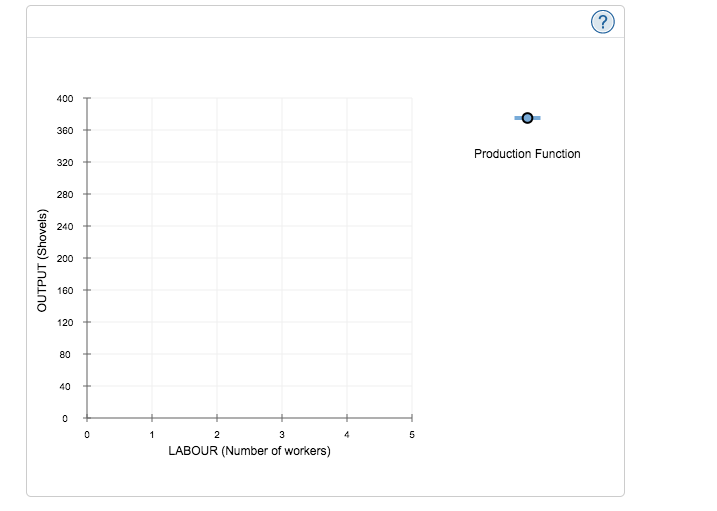
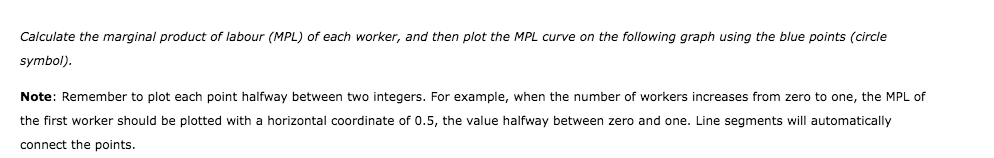
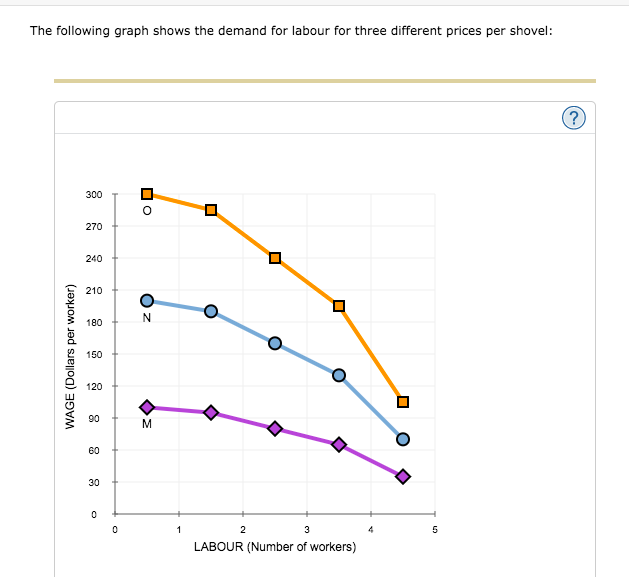

1. Computing labour productivity and its relationship to the demandfor labour Gopher Excavators produces shovels in a small factory and sells the shovels in a competitive market. The following table shows the company's production function: Labour (Number of workers) 0 1 2 3 4 5 Output (Shovels) 0 100 195 275 340 375 Use the blue points (circle symbol) to plot the production function for Gopher Excavators on the following graph. OUTPUT (Shovels) 400 360 320 280 240 200 160 120 80 40 0 0 1 3 LABOUR (Number of workers) 2 5 Production Function ? Calculate the marginal product of labour (MPL) of each worker, and then plot the MPL curve on the following graph using the blue points (circle symbol). Note: Remember to plot each point halfway between two integers. For example, when the number of workers increases from zero to one, the MPL of the first worker should be plotted with a horizontal coordinate of 0.5, the value halfway between zero and one. Line segments will automatically connect the points. MPL (Shovels per worker) 100 90 80 70 60 50 40 30 20 10 0 0 1 3 LABOUR (Number of workers) 2 5 MPL ? The following graph shows the demand for labour for three different prices per shovel: WAGE (Dollars per worker) 300 270 240 210 180 150 120 90 60 30 0 0 O ZO N M 1 U O 2 O 3 LABOUR (Number of workers) 4 5 ? Given the company's marginal product of labour curve shown on the initial graph, line on the previous graph shows Gopher's demand for labour when the price of a shovel is $2.00, and line shows Gopher's demand for labour when the price of a shovel is $3.00.
Step by Step Solution
There are 3 Steps involved in it
1 Plot the production function on the given graph using blue circles Labour Workers 0 Output Shovels ... View full answer

Get step-by-step solutions from verified subject matter experts