

Question: 1. Computing labour productivity and its relationship to the demandfor labour Gopher Excavators produces shovels in a small factory and sells the shovels in a
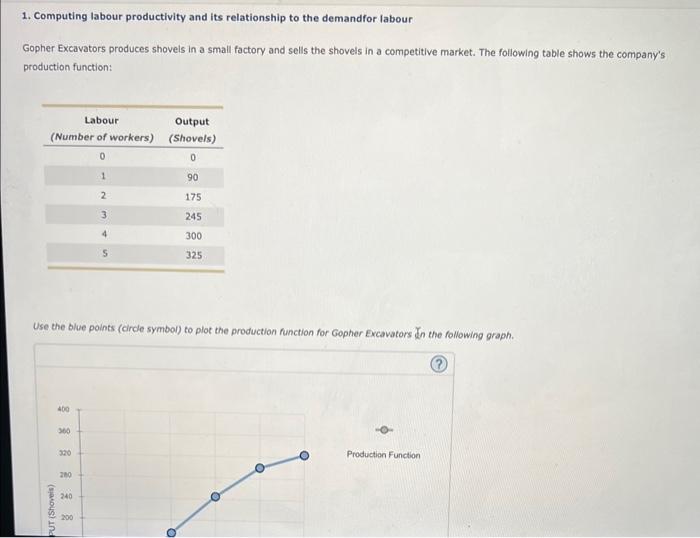
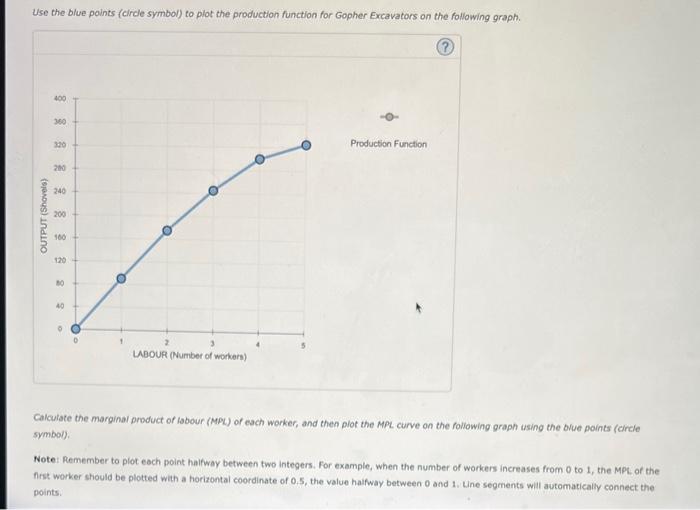
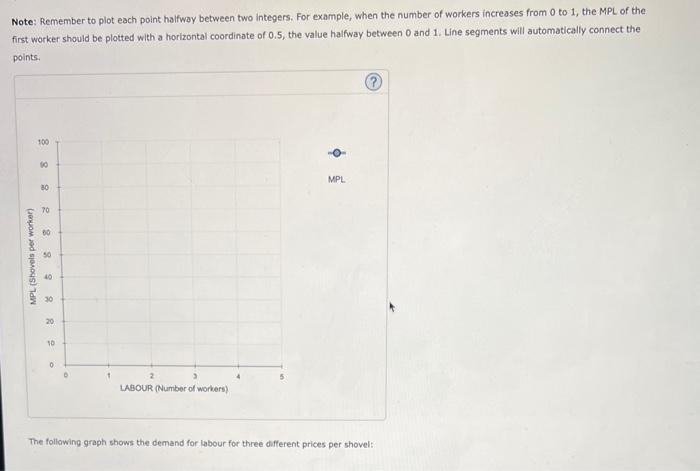
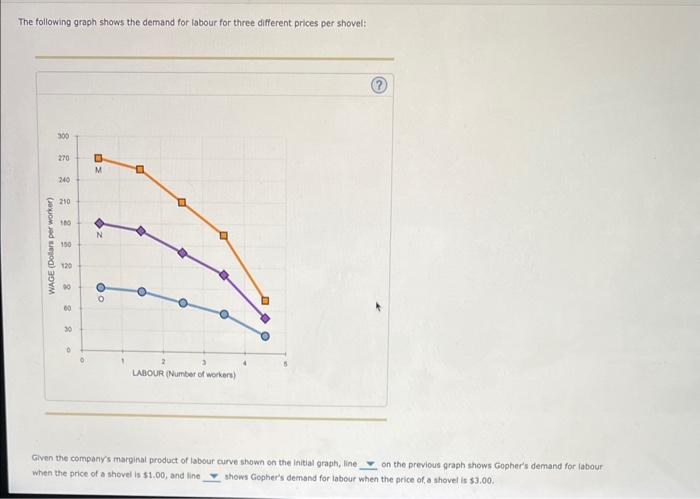
1. Computing labour productivity and its relationship to the demandfor labour Gopher Excavators produces shovels in a small factory and sells the shovels in a competitive market. The following table shows the company's production function: Use the blue points (circle symbol) to plot the production function for Gopher Excavators din the following graph. Use the blue points (circle symbol) to plot the production function for Gopher Excavators on the following graph. Calculate the marginal product of labour (MPL) of each worker, and then plot the MPl curve on the following graph using the blue points (circle symbol). Note: Remember to plot each point halfway between two integers. For example, when the number of workers increases from 0 to 1 , the MPL of the first worker should be plotted with a horizontal coordinate of 0.5, the value halfway between 0 and 1 . Une segments will automatically connect the points. Note: Remember to plot each point halfway between two integers. For example, when the number of workers increases from 0 to 1 , the MPL of the first worker should be plotted with a horizontal coordinate of 0.5, the value halfway between 0 and 1 . Line segments will automatically connect the points. The following graph shows the demand for labour for three different prices per shovel: The following graph shows the demand for labour for three different prices per shovel: Given the company's marginal product of tabour curve shown on the initial graph, line on the previous graph shows Gopher's demand for labour. when the price of a shovel is 31.00, and line shows Gopher's demand for labeur when the price of, ahovel is 53.00
Step by Step Solution
There are 3 Steps involved in it

Get step-by-step solutions from verified subject matter experts