

Question: 1. Conduct a financial statement and operating indicator analysis and interpret the resulting data. Use both national and state competitor data in the analysis. (Note
1. Conduct a financial statement and operating indicator analysis and interpret the resulting data. Use both national and state competitor data in the analysis. (Note that all ratios do not have a complete set of comparative data) 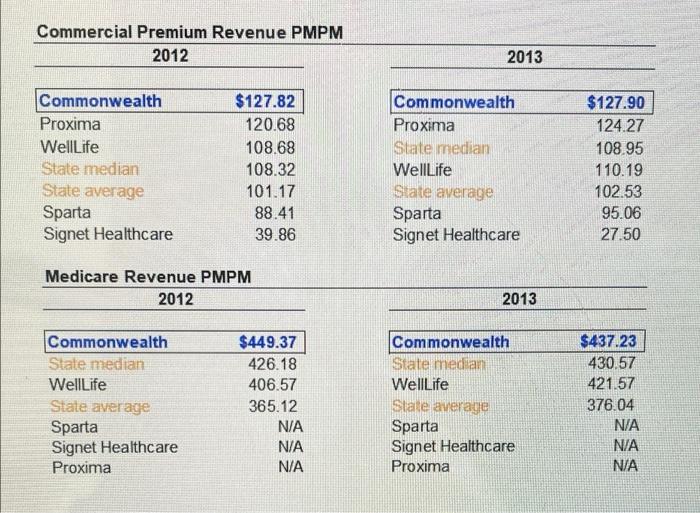
a. Explain Income Indicators
Commercial Premium Revenue PMPM 2012 2013 Commonwealth Proxima WellLife State median State average Sparta Signet Healthcare $127.82 120.68 108.68 108.32 101.17 88.41 39.86 Commonwealth Proxima State median WellLife State average Sparta Signet Healthcare $127.90 124.27 108.95 110.19 102.53 95.06 27.50 Medicare Revenue PMPM 2012 2013 Commonwealth State median Well Life State average Sparta Signet Healthcare Proxima $449.37 426.18 406.57 365.12 N/A N/A Commonwealth State median WellLife State average Sparta Signet Healthcare Proxima $437.23 430.57 421.57 376.04 N/A N/A N/A
Step by Step Solution
There are 3 Steps involved in it
1 Expert Approved Answer
Step: 1 Unlock

Question Has Been Solved by an Expert!
Get step-by-step solutions from verified subject matter experts
Step: 2 Unlock
Step: 3 Unlock