

Question: 1. Consider a factory with the network structure depicted in Figure 1. Figure 1: Product Flow (a) Assume that jobs arrive to the facility in
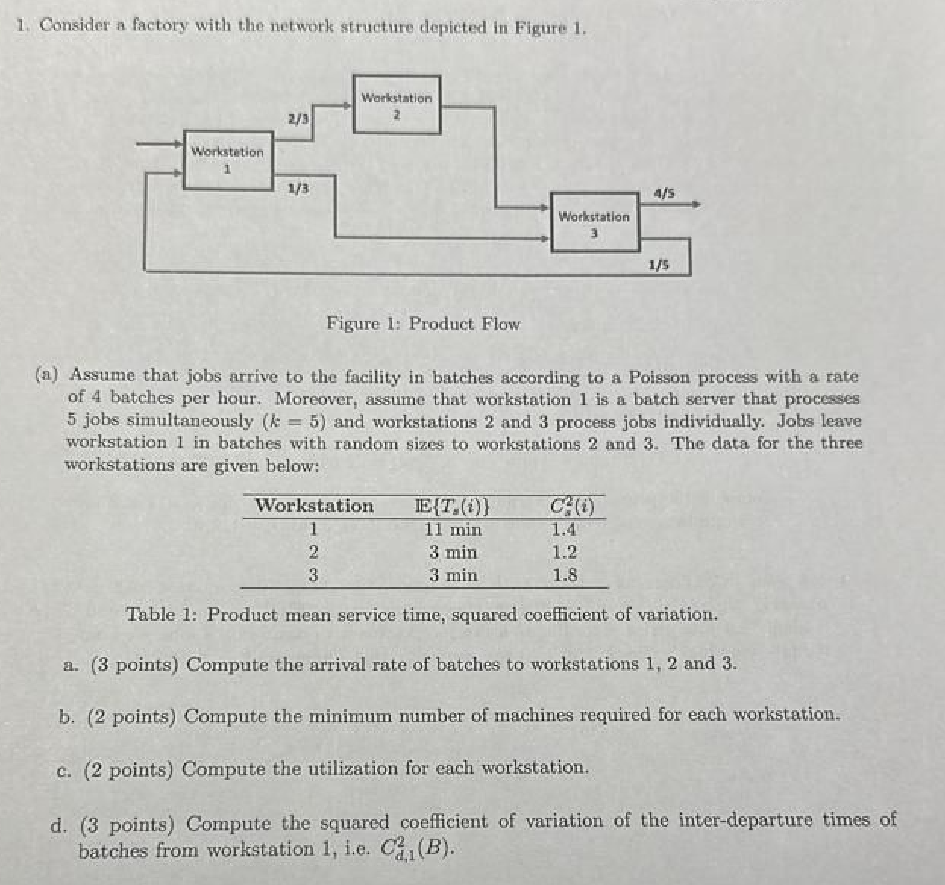
1. Consider a factory with the network structure depicted in Figure 1. Figure 1: Product Flow (a) Assume that jobs arrive to the facility in batches according to a Poisson process with a rate of 4 batches per hour. Moreover, assume that workstation 1 is a batch server that processes 5 jobs simultaneously (k=5) and workstations 2 and 3 process jobs individually. Jobs leave workstation 1 in batches with random sizes to workstations 2 and 3 . The data for the three workstations are given below: Table 1: Product mean service time, squared coefficient of variation. a. ( 3 points) Compute the arrival rate of batehes to workstations 1, 2 and 3 . b. (2 points) Compute the minimum number of machines required for each workstation. c. ( 2 points) Compute the utilization for each workstation. d. (3 points) Compute the squared coefficient of variation of the inter-departure times of batches from workstation 1 , i.e. Cd,12(B)
Step by Step Solution
There are 3 Steps involved in it

Get step-by-step solutions from verified subject matter experts