

Question: 1. Consider the data points shown in the figure. a. (12) By drawing successive boundaries 4 show how these points will be clustered by a
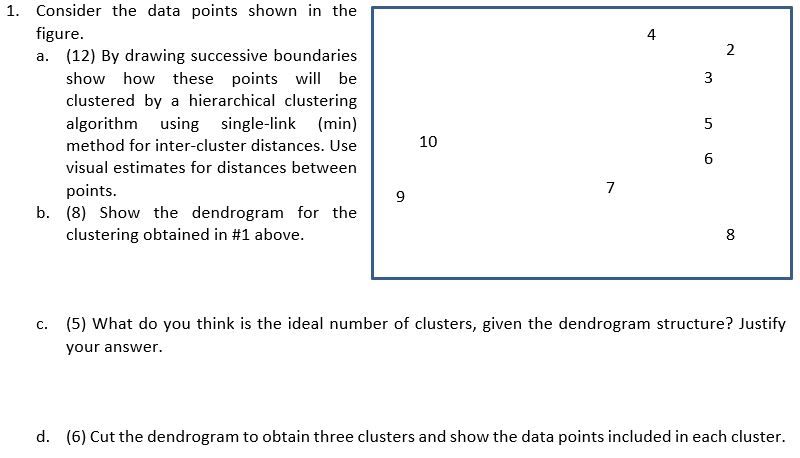
1. Consider the data points shown in the figure. a. (12) By drawing successive boundaries 4 show how these points will be clustered by a hierarchical clustering algorithm using single-link (min) method for inter-cluster distances. Use visual estimates for distances between points 10 6 b. (8) Show the dendrogram for the clustering obtained in #1 above. 8 (5) What do you think is the ideal number of clusters, given the dendrogram structure? Justify your answer. c. d. (6) Cut the dendrogram to obtain three clusters and show the data points included in each cluster. 1. Consider the data points shown in the figure. a. (12) By drawing successive boundaries 4 show how these points will be clustered by a hierarchical clustering algorithm using single-link (min) method for inter-cluster distances. Use visual estimates for distances between points 10 6 b. (8) Show the dendrogram for the clustering obtained in #1 above. 8 (5) What do you think is the ideal number of clusters, given the dendrogram structure? Justify your answer. c. d. (6) Cut the dendrogram to obtain three clusters and show the data points included in each cluster
Step by Step Solution
There are 3 Steps involved in it

Get step-by-step solutions from verified subject matter experts