

Question: 1) Consider the following project information: ACT/ WP 1 2 3 4 5 6 7 Schedule information DUR ES 2 3 2 2 W|N
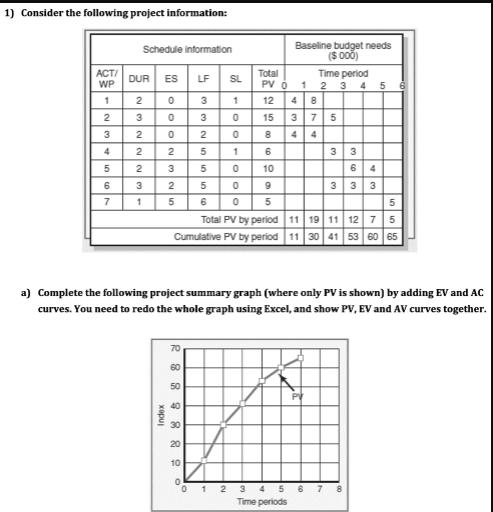
1) Consider the following project information: ACT/ WP 1 2 3 4 5 6 7 Schedule information DUR ES 2 3 2 2 W|N 2 3 1 OOON325 Index 0 0 70 2889 88 20 60 50 40 30 LF SL 3 20 33260 10 5 5 10 10 10 5 9 5 5 Total PV by period 11 19 11 12 7 5 Cumulative PV by period 11 30 41 53 60 65 +00-000 6 1 a) Complete the following project summary graph (where only PV is shown) by adding EV and AC curves. You need to redo the whole graph using Excel, and show PV, EV and AV curves together. Total PV 0 12 15 8 6 10 Baseline budget needs ($ 000) 0 1 2 3 4 5 Time periods 1 48 375 Time period 2 3 4 5 6 PV 6 33 64 333 7
Step by Step Solution
3.44 Rating (154 Votes )
There are 3 Steps involved in it
a Project Summary Graph Index Time period PV EV AC 1 12 111111 2 4 193019 3 8 114130 4 23 125341 5 3... View full answer

Get step-by-step solutions from verified subject matter experts