

Question: I need help figuring out the excel formula's for the above tables. FIGURE A13.1-2B Schedule information Baseline budget needs EV ACT/ Total Time period DUR
I need help figuring out the excel formula's for the above tables.
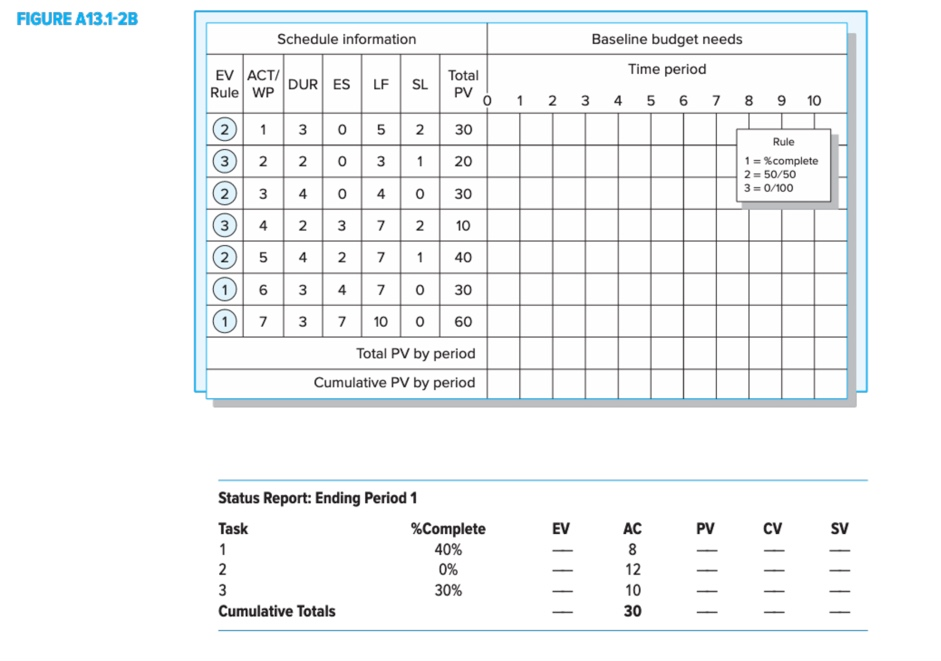
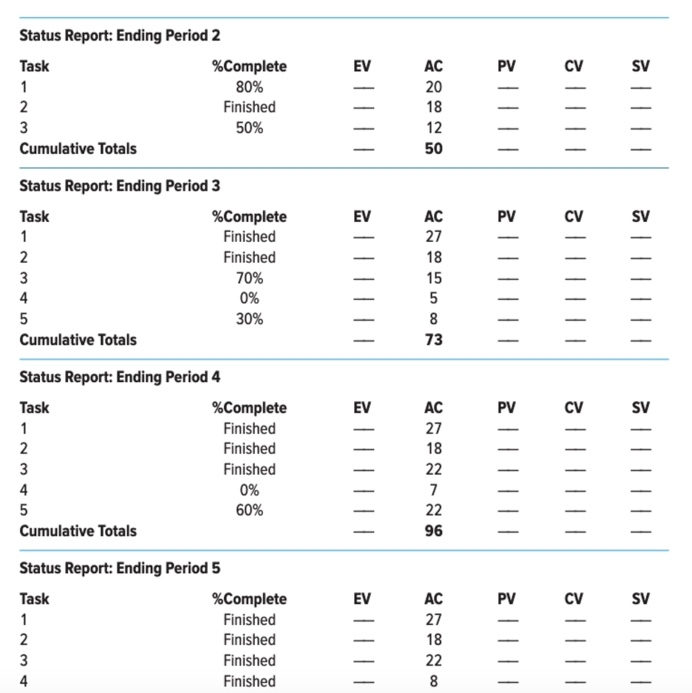
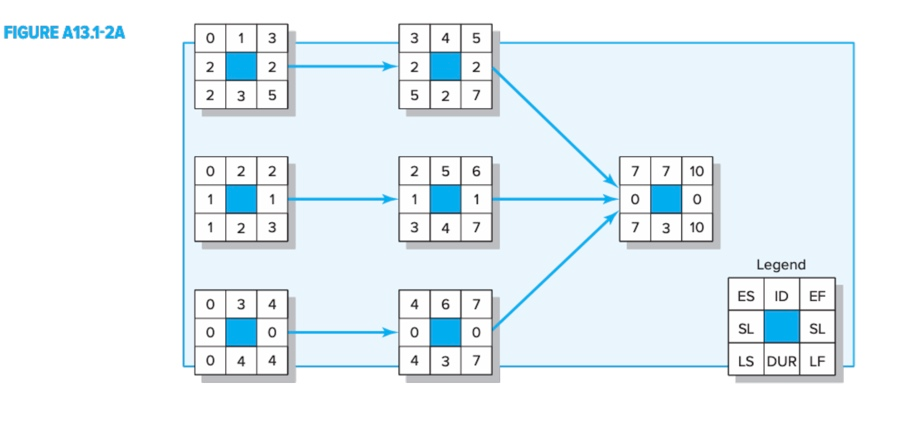
FIGURE A13.1-2B Schedule information Baseline budget needs EV ACT/ Total Time period DUR ESLF Rule WP SL PV 0 1 2 3 4 5 6 7 8 9 10 (2 1 3 05 2 30 Rule * 2 2 0 3 1 20 1 = % complete 2 = 50/50 2 3 4 o 40 30 3 =0/100 3 4 2 3 7 2 10 5 4 2 7 1 40 0 6 3 4 70 30 17 3 7 100 Total PV by period Cumulative PV by period 60 EV PV SV Status Report: Ending Period 1 Task %Complete 1 40% 2 0% 3 30% Cumulative Totals AC 8 12 10 30 |||| ||| EV PV CV SV Status Report: Ending Period 2 Task %Complete 1 80% 2 Finished 3 50% Cumulative Totals AC 20 18 12 111 |||| 50 EV PV CV SV Status Report: Ending Period 3 Task %Complete 1 Finished 2 Finished 3 70% 4 5 30% Cumulative Totals AC 27 18 15 5 8 73 ||| 0% ||||| EV PV CV SV N AC 27 18 22 7 22 0% Status Report: Ending Period 4 Task %Complete 1 Finished 2. Finished 3 Finished 4 5 60% Cumulative Totals Status Report: Ending Period 5 Task %Complete 1 Finished 2. Finished 3 Finished 4 Finished 96 EV PV CV SV AC 27 18 22 8 |||| ||||2 |||| 1 FIGURE A13.1-2A 013 2 2 2. 3 4 5 2. 2 5 27 3 5 022 25 6 1 1 1 1 1 77 10 o 7 3 10 o 1 2 3 3 3 47 034 o Legend ES ID EF SL SL o 467 o 4 3 7 O O 4 4 4 LS DUR LF FIGURE A13.1-2B Schedule information Baseline budget needs EV ACT/ Total Time period DUR ESLF Rule WP SL PV 0 1 2 3 4 5 6 7 8 9 10 (2 1 3 05 2 30 Rule * 2 2 0 3 1 20 1 = % complete 2 = 50/50 2 3 4 o 40 30 3 =0/100 3 4 2 3 7 2 10 5 4 2 7 1 40 0 6 3 4 70 30 17 3 7 100 Total PV by period Cumulative PV by period 60 EV PV SV Status Report: Ending Period 1 Task %Complete 1 40% 2 0% 3 30% Cumulative Totals AC 8 12 10 30 |||| ||| EV PV CV SV Status Report: Ending Period 2 Task %Complete 1 80% 2 Finished 3 50% Cumulative Totals AC 20 18 12 111 |||| 50 EV PV CV SV Status Report: Ending Period 3 Task %Complete 1 Finished 2 Finished 3 70% 4 5 30% Cumulative Totals AC 27 18 15 5 8 73 ||| 0% ||||| EV PV CV SV N AC 27 18 22 7 22 0% Status Report: Ending Period 4 Task %Complete 1 Finished 2. Finished 3 Finished 4 5 60% Cumulative Totals Status Report: Ending Period 5 Task %Complete 1 Finished 2. Finished 3 Finished 4 Finished 96 EV PV CV SV AC 27 18 22 8 |||| ||||2 |||| 1 FIGURE A13.1-2A 013 2 2 2. 3 4 5 2. 2 5 27 3 5 022 25 6 1 1 1 1 1 77 10 o 7 3 10 o 1 2 3 3 3 47 034 o Legend ES ID EF SL SL o 467 o 4 3 7 O O 4 4 4 LS DUR LF
Step by Step Solution
There are 3 Steps involved in it

Get step-by-step solutions from verified subject matter experts