

Question: 1. Consider the following transfer function 1 s(s+4)(s+9) and its frequency response 1 ja (jw+4) (jw+9) The phase chart of its Bode plot goes
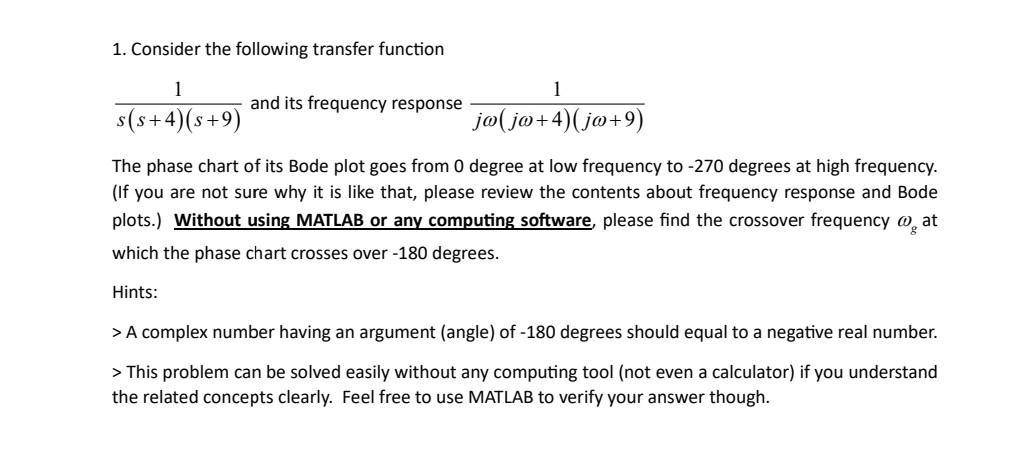
1. Consider the following transfer function 1 s(s+4)(s+9) and its frequency response 1 ja (jw+4) (jw+9) The phase chart of its Bode plot goes from 0 degree at low frequency to -270 degrees at high frequency. (If you are not sure why it is like that, please review the contents about frequency response and Bode plots.) Without using MATLAB or any computing software, please find the crossover frequency @ at which the phase chart crosses over -180 degrees. Hints: > A complex number having an argument (angle) of -180 degrees should equal to a negative real number. > This problem can be solved easily without any computing tool (not even a calculator) if you understand the related concepts clearly. Feel free to use MATLAB to verify your answer though.
Step by Step Solution
3.40 Rating (156 Votes )
There are 3 Steps involved in it
To find the crossover frequency omegag at which the phase chart crosses over 180 degrees we need to ... View full answer

Get step-by-step solutions from verified subject matter experts