

Question: 1. Consider the function f(x,y) = 5y- - x - 1 - x (a) Use MATLAB to produce a surface plot of this function
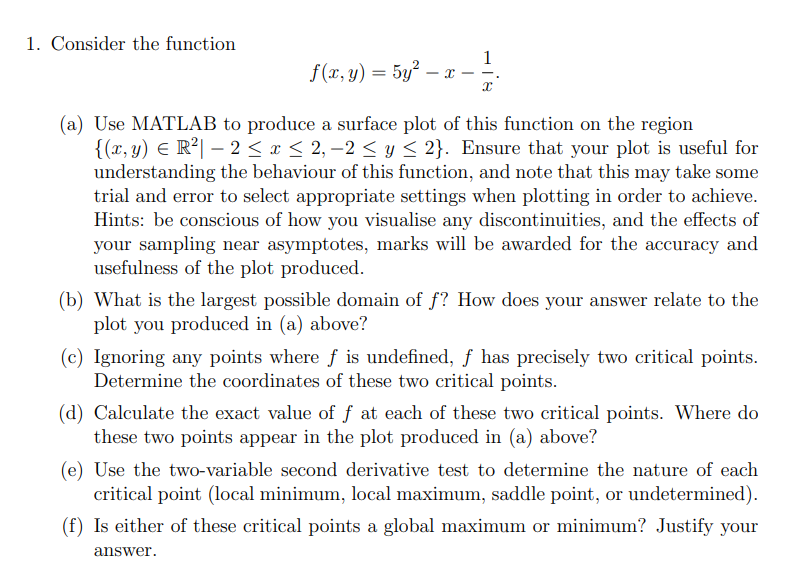
1. Consider the function f(x,y) = 5y- - x - 1 - x (a) Use MATLAB to produce a surface plot of this function on the region {(x, y) = R - 2 x 2, 2 y 2}. Ensure that your plot is useful for understanding the behaviour of this function, and note that this may take some trial and error to select appropriate settings when plotting in order to achieve. Hints: be conscious of how you visualise any discontinuities, and the effects of your sampling near asymptotes, marks will be awarded for the accuracy and usefulness of the plot produced. (b) What is the largest possible domain of f? How does your answer relate to the plot you produced in (a) above? (c) Ignoring any points where f is undefined, has precisely two critical points. Determine the coordinates of these two critical points. (d) Calculate the exact value of at each of these two critical points. Where do these two points appear in the plot produced in (a) above? (e) Use the two-variable second derivative test to determine the nature of each critical point (local minimum, local maximum, saddle point, or undetermined). (f) Is either of these critical points a global maximum or minimum? Justify your answer.
Step by Step Solution
There are 3 Steps involved in it

Get step-by-step solutions from verified subject matter experts