

Question: 1) Consider the graph of y=g)shown below. -10 Evaluate the following limits and values (one point each) a. lim g(x)= b. lim g(x)= d
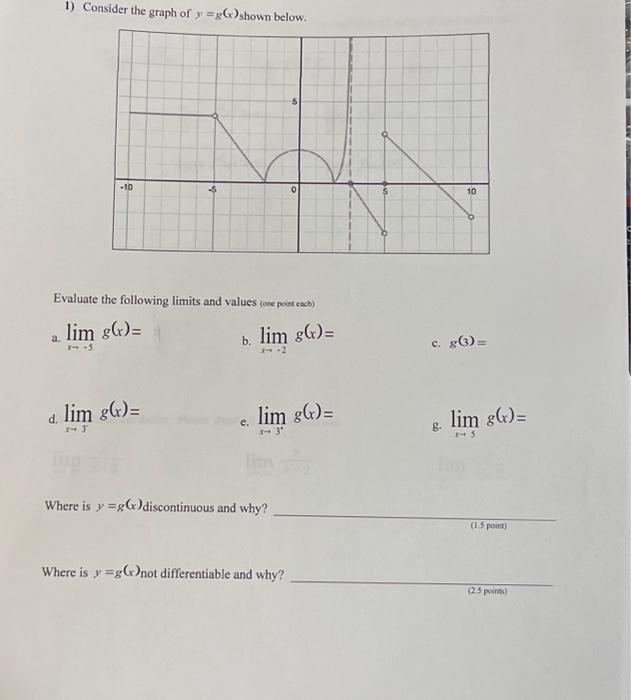
1) Consider the graph of y=g)shown below. -10 Evaluate the following limits and values (one point each) a. lim g(x)= b. lim g(x)= d lim g(x)= 0 lim g(x)= Where is y=g(x)discontinuous and why? Where is y=g(x)not differentiable and why? C. 8. 10 lim g(x)= 15 (1.5 point) (2.5 points)
Step by Step Solution
★★★★★
3.39 Rating (149 Votes )
There are 3 Steps involved in it
1 Expert Approved Answer
Step: 1 Unlock

a STEP 1 Given a function y gx as shown in the given graph ... View full answer
Question Has Been Solved by an Expert!
Get step-by-step solutions from verified subject matter experts
Step: 2 Unlock
Step: 3 Unlock