

Question: Assume you are considering a portfolio containing two assets, L and M. Asset L will represent 40% of the dollar value of the portfolio, and
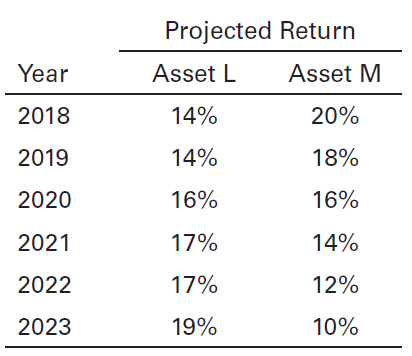
Assume you are considering a portfolio containing two assets, L and M. Asset L will represent 40% of the dollar value of the portfolio, and asset M will account for the other 60%. The projected returns over the next six years, 2018-2023, for each of these assets are summarized in the following table.
a. Use an Excel spreadsheet to calculate the projected portfolio return,![]() , for each of the six years.
, for each of the six years.
b. Use an Excel spreadsheet to calculate the average portfolio return,![]() , over the six-year period.
, over the six-year period.
c. Use an Excel spreadsheet to calculate the standard deviation of expected portfolio returns, sp, over the six-year period.
d. How would you characterize the correlation of returns of the assets L and M?
e. Discuss any benefits of diversification achieved through creation of the portfolio.
Projected Return Year Asset L Asset M 14% 20% 2018 14% 2019 18% 16% 16% 2020 2021 17% 14% 17% 12% 2022 2023 10% 19%
Step by Step Solution
3.46 Rating (159 Votes )
There are 3 Steps involved in it
a Average portfolio return for each year r p w L r L w M r M Year Asse... View full answer

Get step-by-step solutions from verified subject matter experts
Document Format (1 attachment)
1136-B-C-F-B-V(1631).docx
120 KBs Word File