

Question: 1. Construct a boxplot for the Final Weight Lift variable grouped by the Year variable (select Year under Group by:). Properly
1.
Construct a boxplot for the "Final Weight Lift" variable grouped by the "Year" variable (select Year under Group by:). Properly title and label your graph. Copy and paste this graph into your solutions document.
Answer:
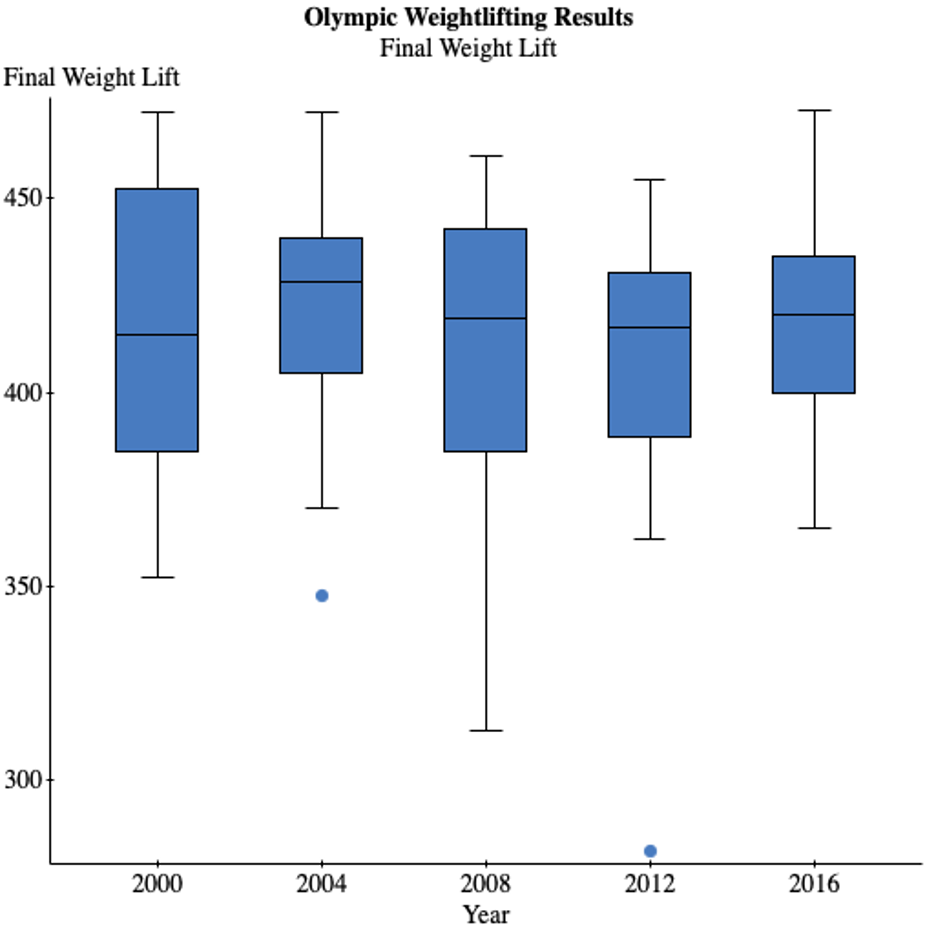
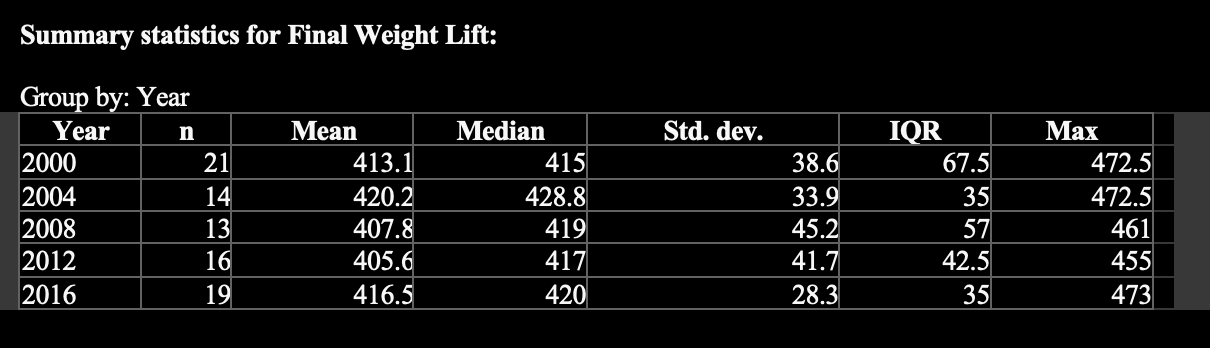
Olympic Weightlifting Results Final Weight Lift Final Weight Lift 450 400 350 300 2000 2004 2008 2012 2016 YearSummary statistics for Final Weight Lift: Group by: Year Year 11 Mean Median 2000 21 413.1 415 2004 14 420.2 428.8 2.008 13 407.8 419 2.012 16 405.6 417 2.016 19 416.5 42.0
Step by Step Solution
There are 3 Steps involved in it
1 Expert Approved Answer
Step: 1 Unlock

Question Has Been Solved by an Expert!
Get step-by-step solutions from verified subject matter experts
Step: 2 Unlock
Step: 3 Unlock