

Question: Can you solve only 2 or 3 with an explanation so I can do the rest myself, please? I will do it on excel. Thank
Can you solve only 2 or 3 with an explanation so I can do the rest myself, please? I will do it on excel. Thank you. (It is hard to see make it closer) there are instructions and data set
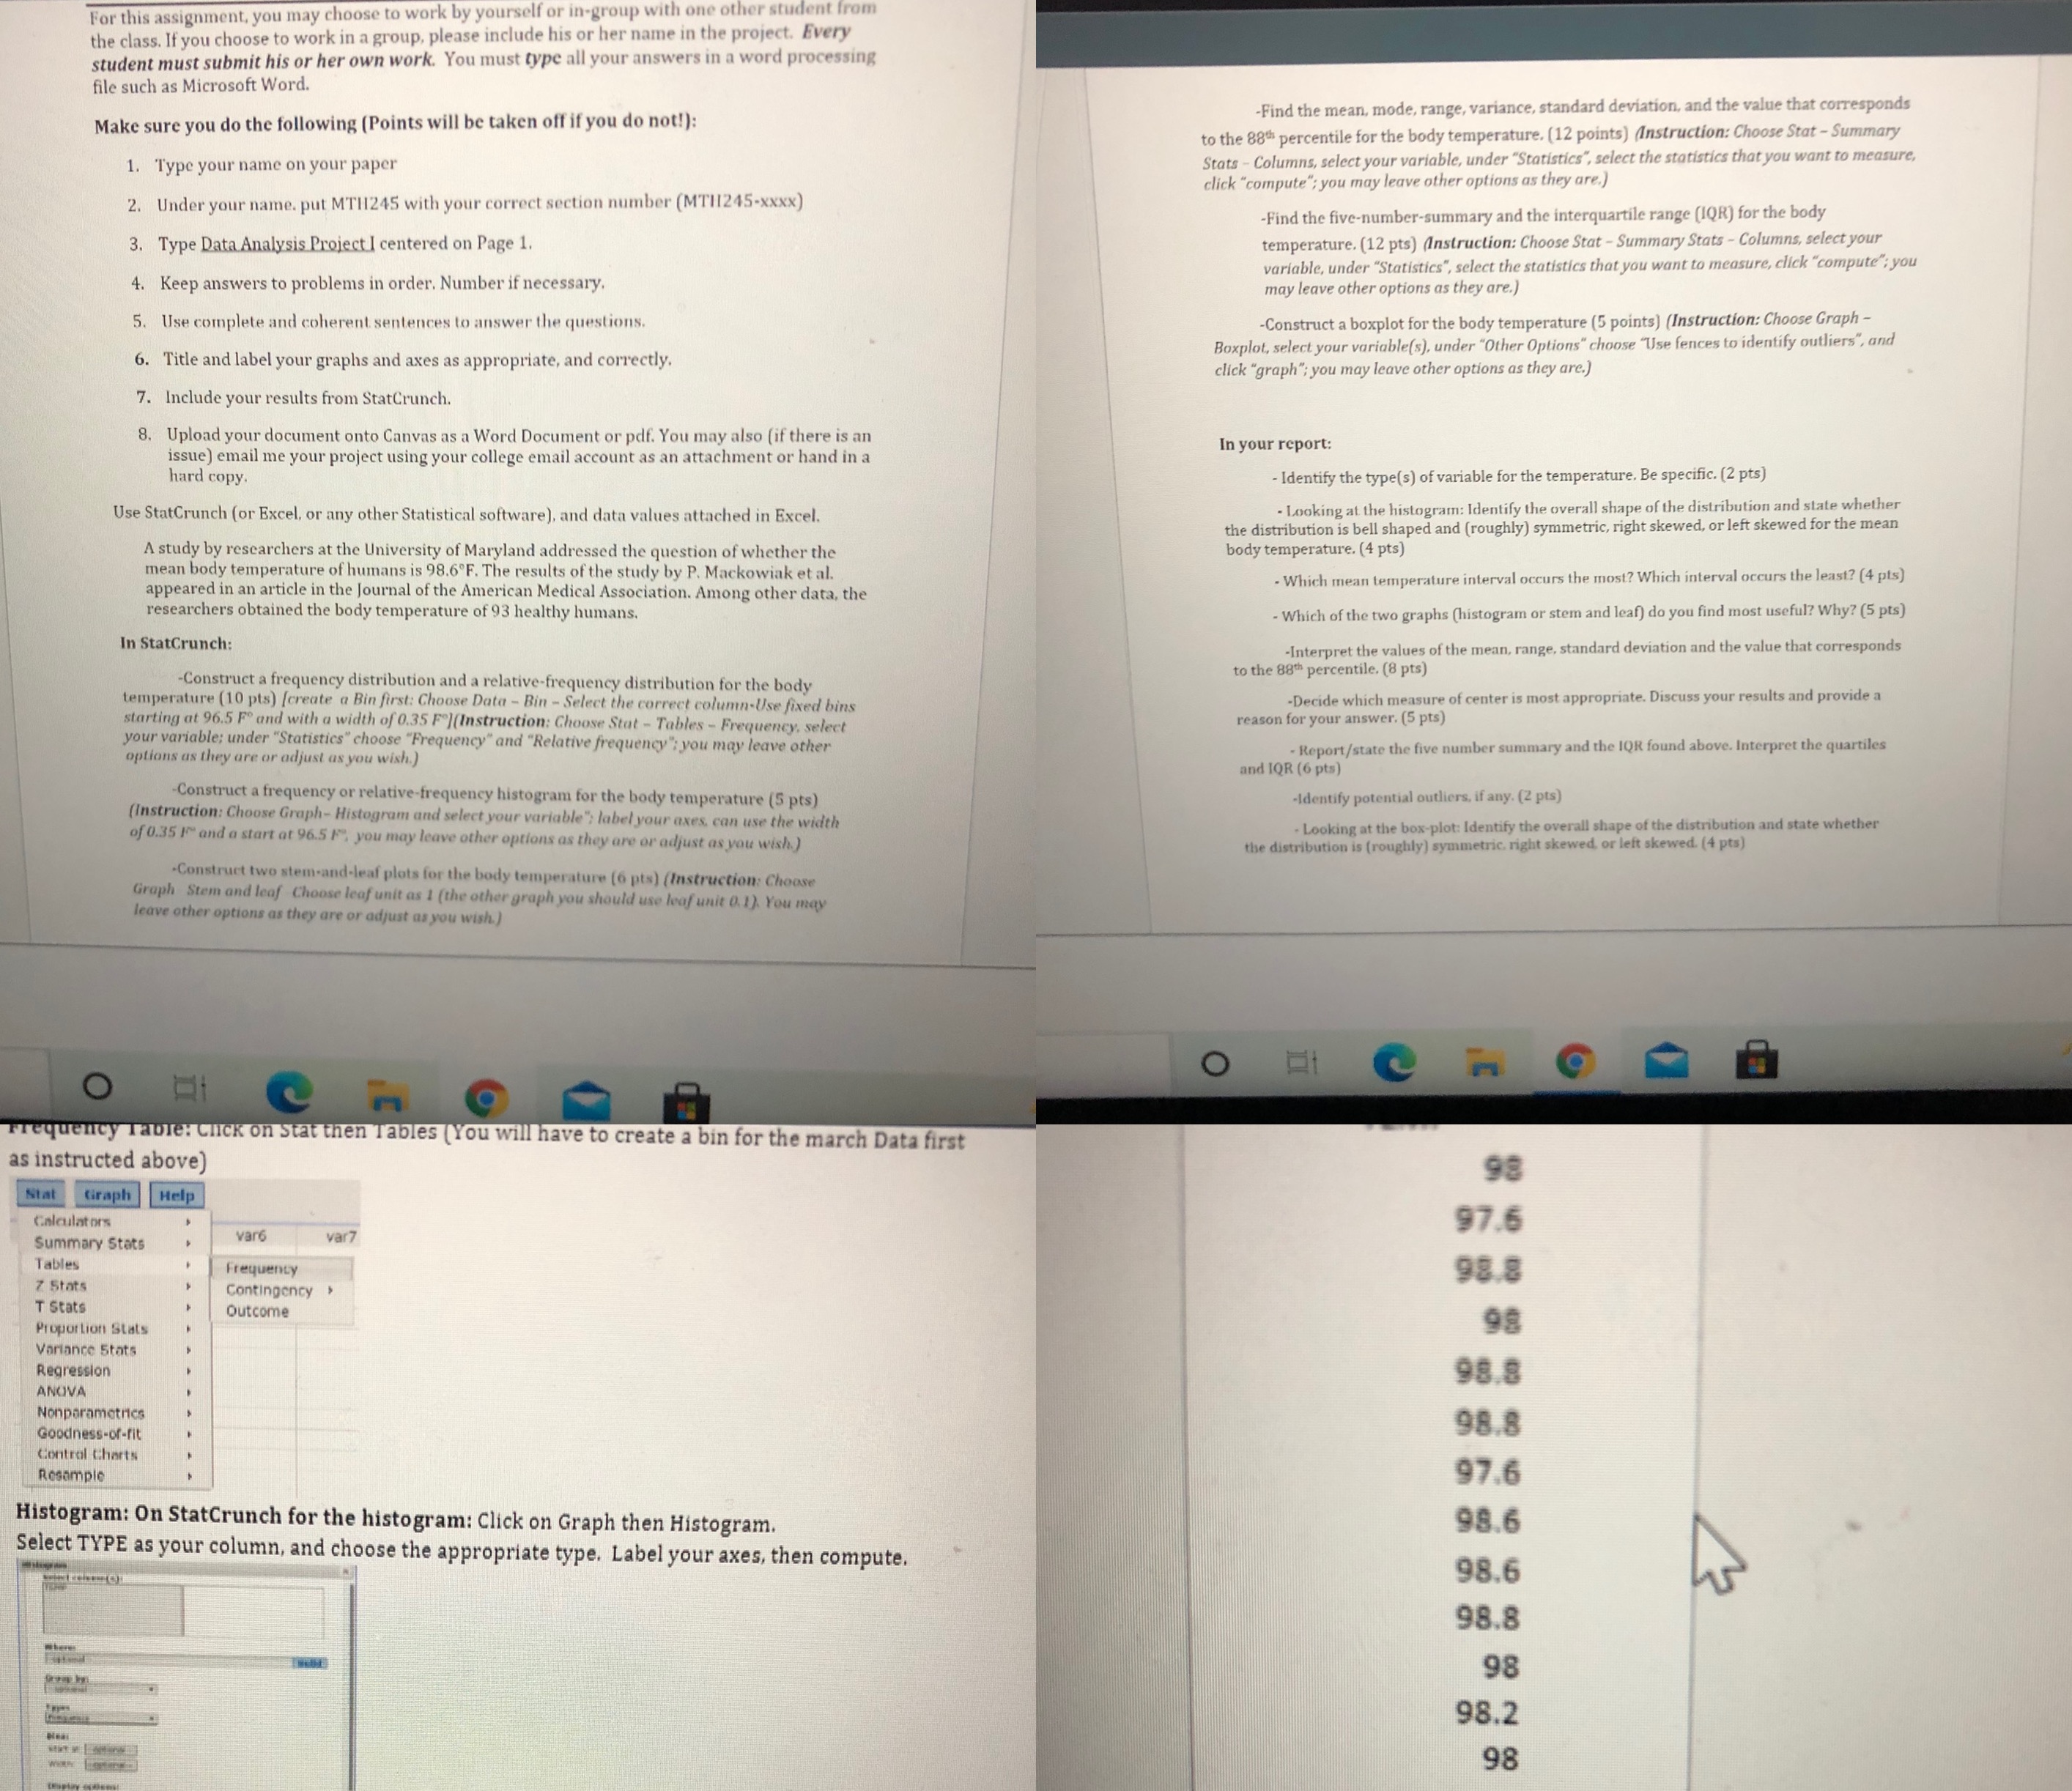
For this assignment, you may choose to work by yourself or in-group with one other student the class. If you choose to work in a group, please include his or her name in the project. Every student must submit his or her own work. You must type all your answers in a word processing file such as Microsoft Word. Make sure you do the following (Points will be taken off if you do not!): -Find the mean, mode, range, variance, standard deviation, and the value that corresponds to the 88th percentile for the body temperature. (12 points) (Instruction: Choose Stat - Summary 1. Type your name on your paper Stats - Columns, select your variable, under "Statistics", select the statistics that you want to measure, click "compute"; you may leave other options as they are.) 2. Under your name. put MTH1245 with your correct section number (MTI1245-xxxx) -Find the five-number-summary and the interquartile range (IQR) for the body 3. Type Data Analysis Project I centered on Page 1. temperature. (12 pts) (Instruction: Choose Stat - Summary Stats - Columns, select your variable, under "Statistics", select the statistics that you want to measure, click "compute"; you 4. Keep answers to problems in order. Number if necessary. may leave other options as they are.) 5. Use complete and coherent sentences to answer the questions. -Construct a boxplot for the body temperature (5 points) (Instruction: Choose Graph - 6. Title and label your graphs and axes as appropriate, and correctly. Boxplot, select your variable(s), under "Other Options" choose "Use fences to identify outliers", and click "graph"; you may leave other options as they are.) 7. Include your results from StatCrunch. 8. Upload your document onto Canvas as a Word Document or pdf. You may also ( if there is an issue) email me your project using your college email account as an attachment or hand in a In your report: hard copy. - Identify the type(s) of variable for the temperature. Be specific. (2 pts) Use StatCrunch (or Excel, or any other Statistical software), and data values attached in Excel. - Looking at the histogram: Identify the overall shape of the distribution and state whether the distribution is bell shaped and (roughly) symmetric, right skewed, or left skewed for the mean A study by researchers at the University of Maryland addressed the question of whether the body temperature. (4 pts) mean body temperature of humans is 98.6'F. The results of the study by P. Mackowiak et al. appeared in an article in the Journal of the American Medical Association. Among other data, the . Which mean temperature interval occurs the most? Which interval occurs the least? (4 pts) researchers obtained the body temperature of 93 healthy humans. - Which of the two graphs (histogram or stem and leaf) do you find most useful? Why? (5 pts) In StatCrunch -Interpret the values of the m standard deviation and the value that corresponds -Construct a frequency distribution and a relative-frequency distribution for the body to the 88th percentile. (8 pts) temperature (10 pts) [create a Bin first: Choose Data - Bin - Select the correct column-Use fixed bins -Decide which measure of center is m s your results and provide a starting at 96.5 Fo and with a width of 0.35 Fol(Instruction: Choose Stat - Tables - Frequency, select reason for your answer. (5 pts) your variable; under "Statistics" choose "F atistics" choose "Frequency" and "Relative frequency "; you may leave other options as they are or adjust as you wish.) - Report/state the five number summary and the 1QR found above. Interpret the quartiles and IQR (6 pts) -Construct a frequency or relative-frequency histogram for the body temperature (5 pts) -Identify potential outliers, if any. (2 pts) (Instruction: Choose Graph- Histogram and select your variable": label your axes, can use the width of 0.35 F and a start at 96.5 F. you may leave other options as they are or adjust as you wish) - Looking at the box-plot: Identify the overall shape of the distribution and state whether the distribution is (roughly) symmetric, right skewed. or left skewed. (4 pts) .Construct two stem-and-leaf plots for the body temperature (6 pts) (Instruction: Choose Graph Stem and leaf Choose leaf unit as 1 (the other graph you should use leaf unit 0.1). You may leave other options as they are or adjust as you wish.) O O m Frequency Table: Click on Stat then Tables (You will have to create a bin for the march Data first as instructed above) 98 Stat Graph Help Calculators var6 97.6 Summary Stats Tables Frequency 98.8 z State Contingency > T Stats Outcome Proportion Stats 98 Variance Stats Regression 98.8 Nonparametrics Goodness-of-rit 98.8 Control Charts Resample 97.6 Histogram: On StatCrunch for the histogram: Click on Graph then Histogram. 98.6 Select TYPE as your column, and choose the appropriate type. Label your axes, then compute. 98.6 98.8 98 98.2 98
Step by Step Solution
There are 3 Steps involved in it

Get step-by-step solutions from verified subject matter experts