

Question: 1) Construct a contingency table that cross-classifies the data by Type and Region. How many of the schools are Public? How many of the schools
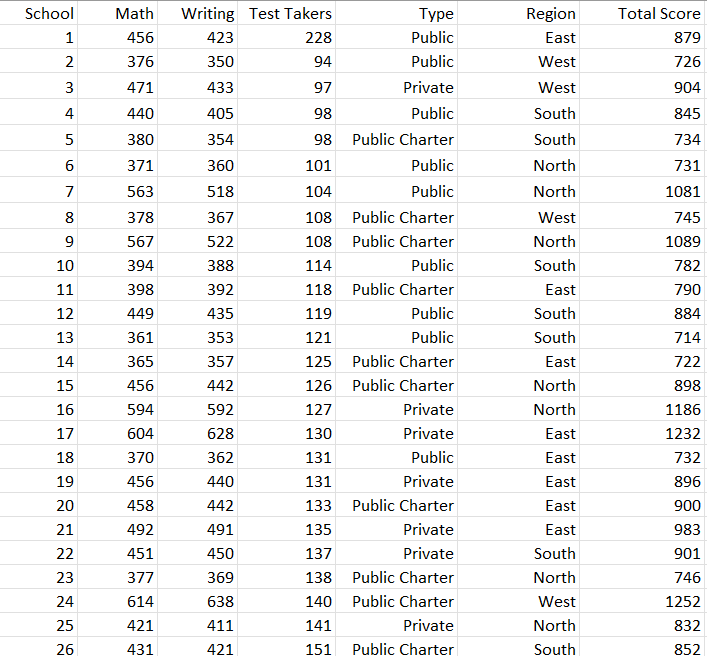
1) Construct a contingency table that cross-classifies the data by Type and Region. How many of the schools are Public? How many of the schools are in the North?
2) Given that a school is in the north, what is the likelihood that the school is private? Given that a school is in the south, what is the likelihood that the school is public?
3) Calculate the mean, the variance, and the standard deviation for each type of school.
4) Which type had the highest average Total Score?
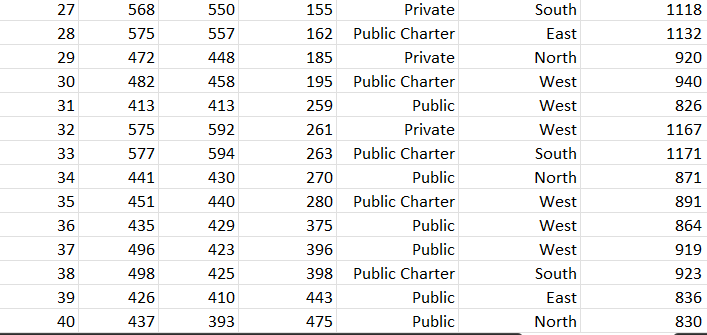
\begin{tabular}{|r|r|r|r|r|r|r|} \hline 27 & 568 & 550 & 155 & Private & South & 1118 \\ \hline 28 & 575 & 557 & 162 & Public Charter & East & 1132 \\ \hline 29 & 472 & 448 & 185 & Private & North & 920 \\ \hline 30 & 482 & 458 & 195 & Public Charter & West & 940 \\ \hline 31 & 413 & 413 & 259 & Public & West & 826 \\ \hline 32 & 575 & 592 & 261 & Private & West & 1167 \\ \hline 33 & 577 & 594 & 263 & Public Charter & South & 1171 \\ \hline 34 & 441 & 430 & 270 & Public & North & 871 \\ \hline 35 & 451 & 440 & 280 & Public Charter & West & 891 \\ \hline 36 & 435 & 429 & 375 & Public & West & 864 \\ \hline 37 & 496 & 423 & 396 & Public & West & 919 \\ \hline 38 & 498 & 425 & 398 & Public Charter & South & 923 \\ \hline 39 & 426 & 410 & 443 & Public & East & 836 \\ \hline 40 & 437 & 393 & 475 & Public & North & 830 \\ \hline \end{tabular}
Step by Step Solution
There are 3 Steps involved in it

Get step-by-step solutions from verified subject matter experts