

Question: 1) Construct the frequency distribution and the histogram. Use six intervals with widths of 700 < x 800; 800 < x 900; etc.
1) Construct the frequency distribution and the histogram. Use six intervals with widths of 700 < x ≤ 800; 800 < x ≤ 900; etc. How many schools achieved an average total score higher than 1000?
2) Is the distribution symmetric? If not, is it positively or negatively skewed?
3) Construct a contingency table that cross-classifies the data by Type and Region. How many of the schools are Public? How many of the schools are in the North?
4) Construct a stacked column chart. Comment on the findings.
5) Calculate the mean, the variance, and the standard deviation for each type of school. 6) Which type had the highest average Total Score? 7) Which Type had a greater dispersion as measured by the standard deviation? 8) In terms of kurtosis, rank order the types of schools.
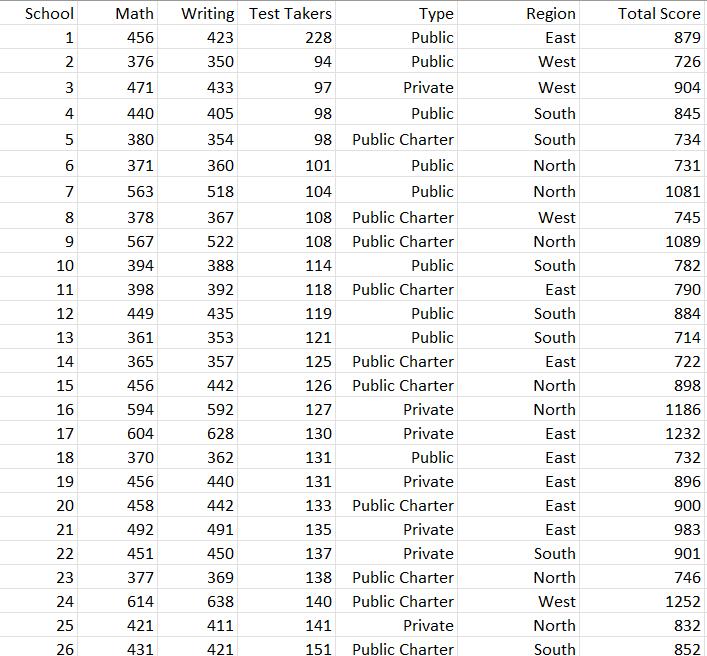

School 1 2 3 4 5 6 7 8 9 10 11 12 13 14 15 16 17 18 19 20 21 22 23 24 25 26 Math 456 376 471 440 380 371 563 378 567 394 398 449 361 365 456 594 604 370 456 458 492 451 377 614 421 431 Writing Test Takers Type 423 228 Public 350 94 Public 433 97 Private 405 98 Public 354 98 Public Charter 360 101 Public 518 104 Public 367 108 Public Charter 522 108 Public Charter 388 114 Public 392 118 Public Charter 435 119 Public 353 Public 357 442 592 628 362 440 442 491 450 369 638 411 421 121 125 Public Charter 126 Public Charter 127 Private 130 Private 131 Public 131 Private 133 Public Charter 135 Private 137 Private 138 Public Charter 140 Public Charter 141 Private 151 Public Charter Region East West West South South North North West North South East South South East North North East East East East East South North West North South Total Score 879 726 904 845 734 731 1081 745 1089 782 790 884 714 722 898 1186 1232 732 896 900 983 901 746 1252 832 852
Step by Step Solution
3.40 Rating (162 Votes )
There are 3 Steps involved in it
1 To construct the frequency distribution and histogram we first need to create intervals with a width of 100 The intervals are 700 799 800 899 900 999 1000 1099 1100 1199 1200 1299 Using these interv... View full answer

Get step-by-step solutions from verified subject matter experts