

Question: 1. Construct a stem and leaf plot, comment on the shape. 2. Check the empirical rule for the given dataset. 3. Which is the better
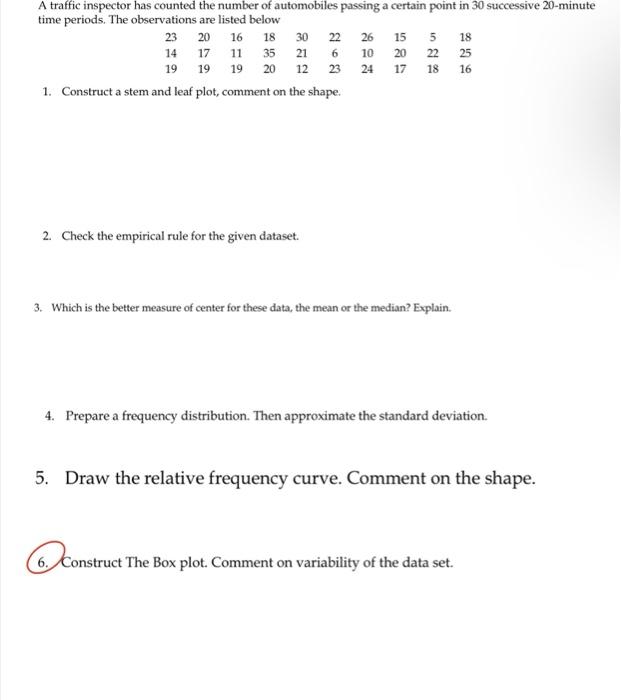
1. Construct a stem and leaf plot, comment on the shape. 2. Check the empirical rule for the given dataset. 3. Which is the better measure of center for these data, the mean or the median? Explain. 4. Prepare a frequency distribution. Then approximate the standard deviation. 5. Draw the relative frequency curve. Comment on the shape. 6. Construct The Box plot. Comment on variability of the data set
Step by Step Solution
There are 3 Steps involved in it
1 Expert Approved Answer
Step: 1 Unlock

Question Has Been Solved by an Expert!
Get step-by-step solutions from verified subject matter experts
Step: 2 Unlock
Step: 3 Unlock