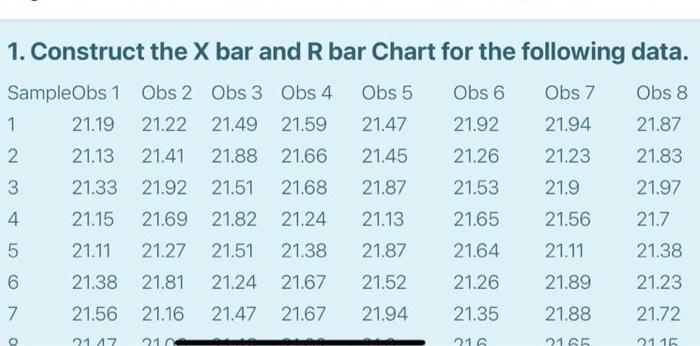
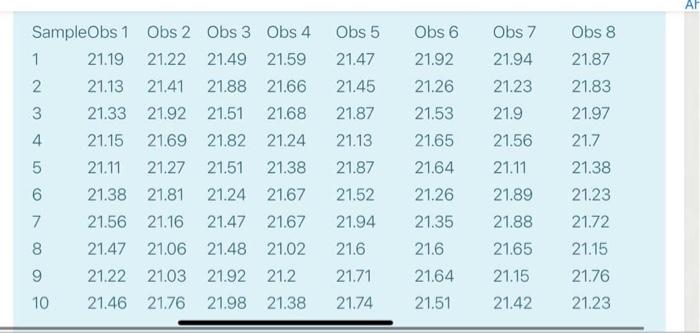
Question: 1. Construct the X bar and R bar Chart for the following data. SampleObs 1 Obs 2 Obs 3 Obs 4 Obs 5 Obs 6

1. Construct the X bar and R bar Chart for the
1. Construct the X bar and R bar Chart for the following data. SampleObs 1 Obs 2 Obs 3 Obs 4 Obs 5 Obs 6 Obs 7 Obs 8 1 21.19 21.22 21.49 21.59 21.47 21.92 21.94 21.87 2 21.13 21.41 21.88 21.66 21.45 21.26 21.23 21.83 3 21.33 21.92 21.51 21.68 21.87 21.53 21.9 21.97 4. 21.15 21.69 21.82 21.24 21.13 21.65 21.56 21.7 5 21.11 21.27 21.51 21.38 21.87 21.64 21.11 21.38 6 21.38 21.81 21.24 21.67 21.52 21.26 21.89 21.23 7 21.56 21.16 21.47 21.67 21.94 21.35 21.88 21.72 o 2147 10 21 105 2115 AP SampleObs 1 1 21.19 2 21.13 3 21.33 4 21.15 5 21.11 6 21.38 7 21.56 8 21.47 Obs 2 Obs 3 Obs 4 21.22 21.49 21.59 21.41 21.88 21.66 21.92 21.51 21.68 21.69 21.82 21.24 21.27 21.51 21.38 21.81 21.24 21.67 21.16 21.47 21.67 21.06 21.48 21.02 21.03 21.92 21.2 21.76 21.98 21.38 Obs 5 21.47 21.45 21.87 21.13 21.87 21.52 21.94 Obs 8 21.87 21.83 21.97 21.7 Obs6 21.92 21.26 21.53 21.65 21.64 21.26 21.35 21.6 21.64 21.51 Obs 7 21.94 21.23 21.9 21.56 21.11 21.89 21.88 21.65 21.38 21.23 21.72 21.15 21.76 21.23 9 21.6 21.71 21.74 21.22 21.46 21.15 21.42 10

Step by Step Solution

There are 3 Steps involved in it

1 Expert Approved Answer
Step: 1 Unlock blur-text-image
Question Has Been Solved by an Expert!

Get step-by-step solutions from verified subject matter experts

Step: 2 Unlock
Step: 3 Unlock

Students Have Also Explored These Related General Management Questions!