

Question: please try to give the right answer ( thanks in advance ) 18 You are to construct an x-bar chart such that the control limits
please try to give the right answer 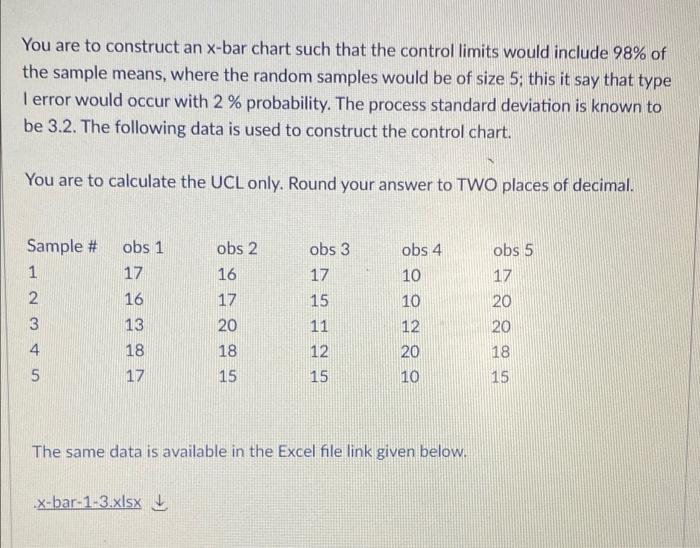
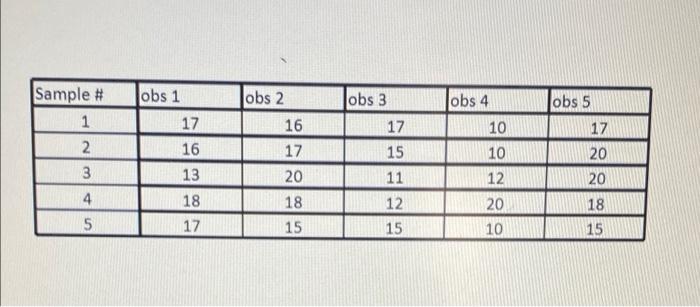
You are to construct an x-bar chart such that the control limits would include 98% of the sample means, where the random samples would be of size 5; this it say that type 1 error would occur with 2 % probability. The process standard deviation is known to be 3.2. The following data is used to construct the control chart. You are to calculate the UCL only. Round your answer to TWO places of decimal. Sample # 1 2 3 4 obs 1 17 16 13 18 17 obs 2 16 17 20 18 15 obs 3 17 15 11 12 15 obs 4 10 10 12 20 10 obs 5 17 20 20 18 15 5 The same data is available in the Excel file link given below. -x-bar-1-3.xlsx Sample # 1 obs 4 Jobs 3 17 10 obs 1 17 16 13 18 17 Jobs 2 16 17 20 2. 15 10 3 obs 5 17 20 20 18 15 12 4 18 15 11 12 15 5 20 10
( thanks in advance )
18
Step by Step Solution
There are 3 Steps involved in it
1 Expert Approved Answer
Step: 1 Unlock

Question Has Been Solved by an Expert!
Get step-by-step solutions from verified subject matter experts
Step: 2 Unlock
Step: 3 Unlock