

Question: 1. Correlation Coefficient 01 Bird species from temperate regions must cope with relatively short breeding seasons. A study examined the relationship between blood testosterone level
1.
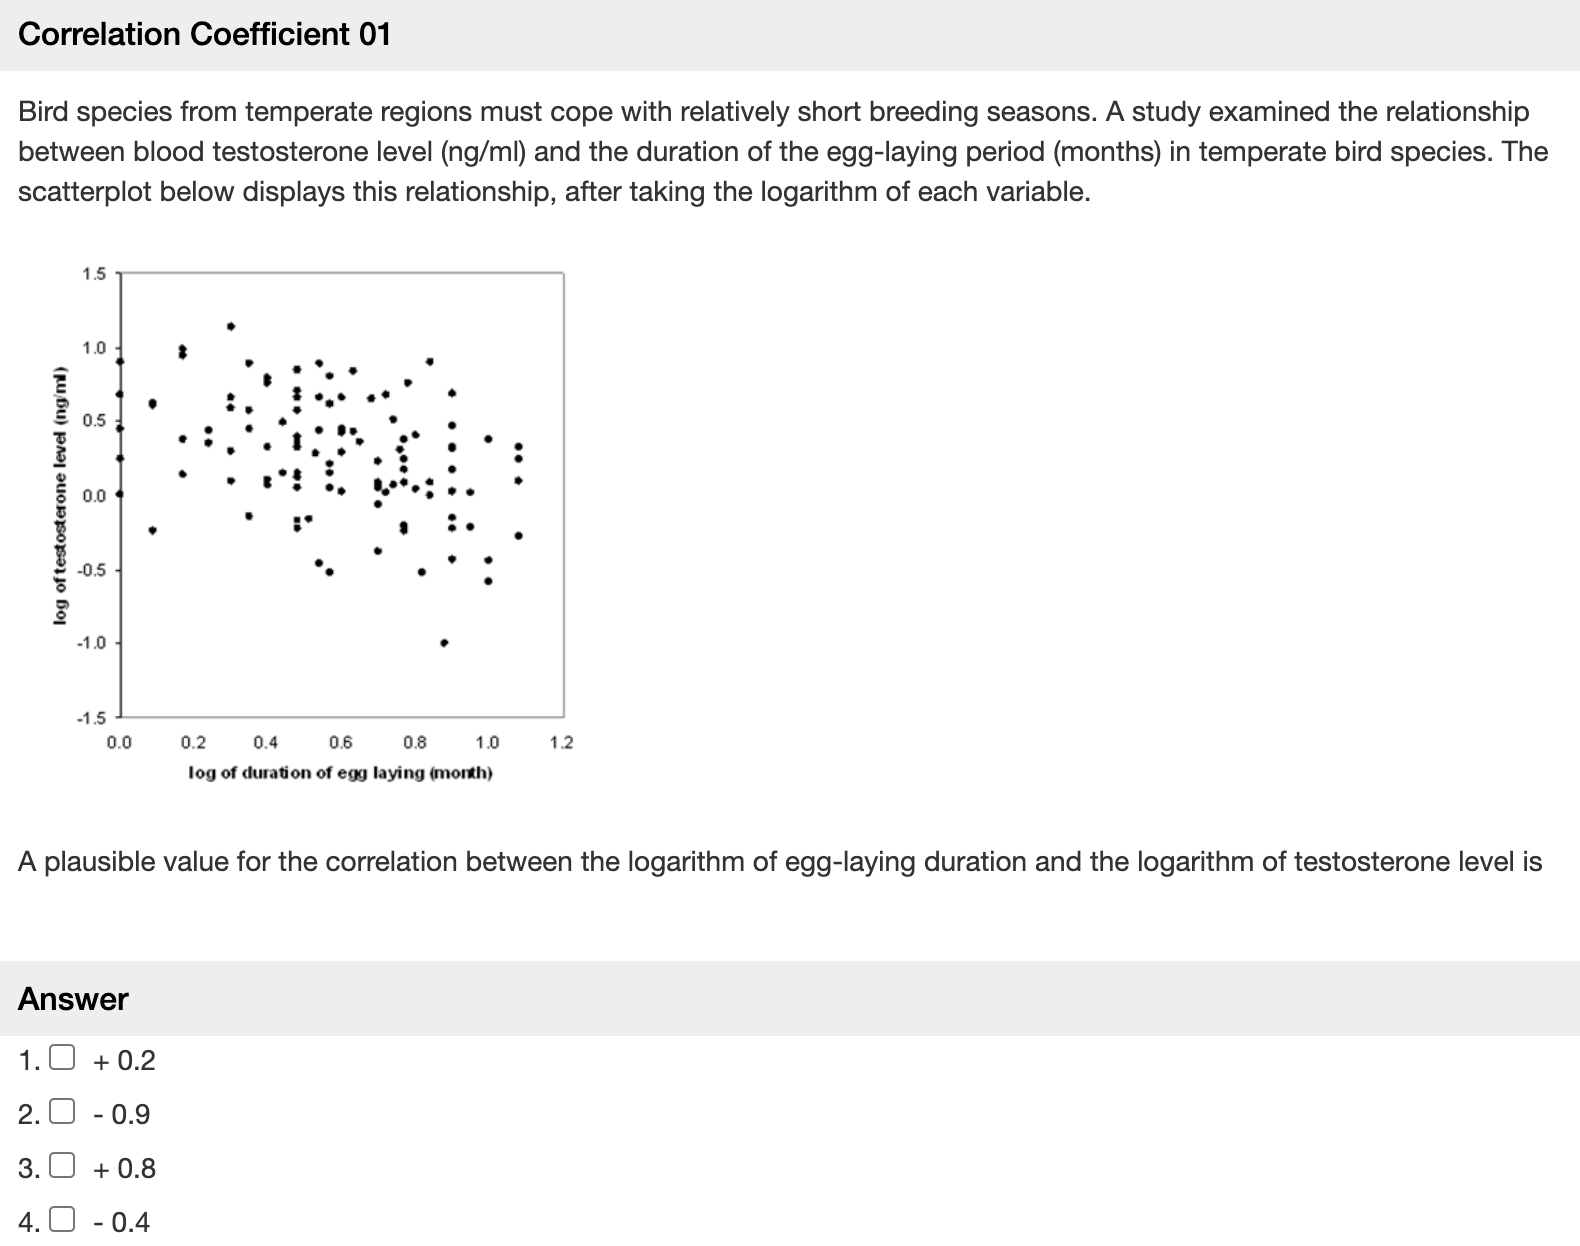
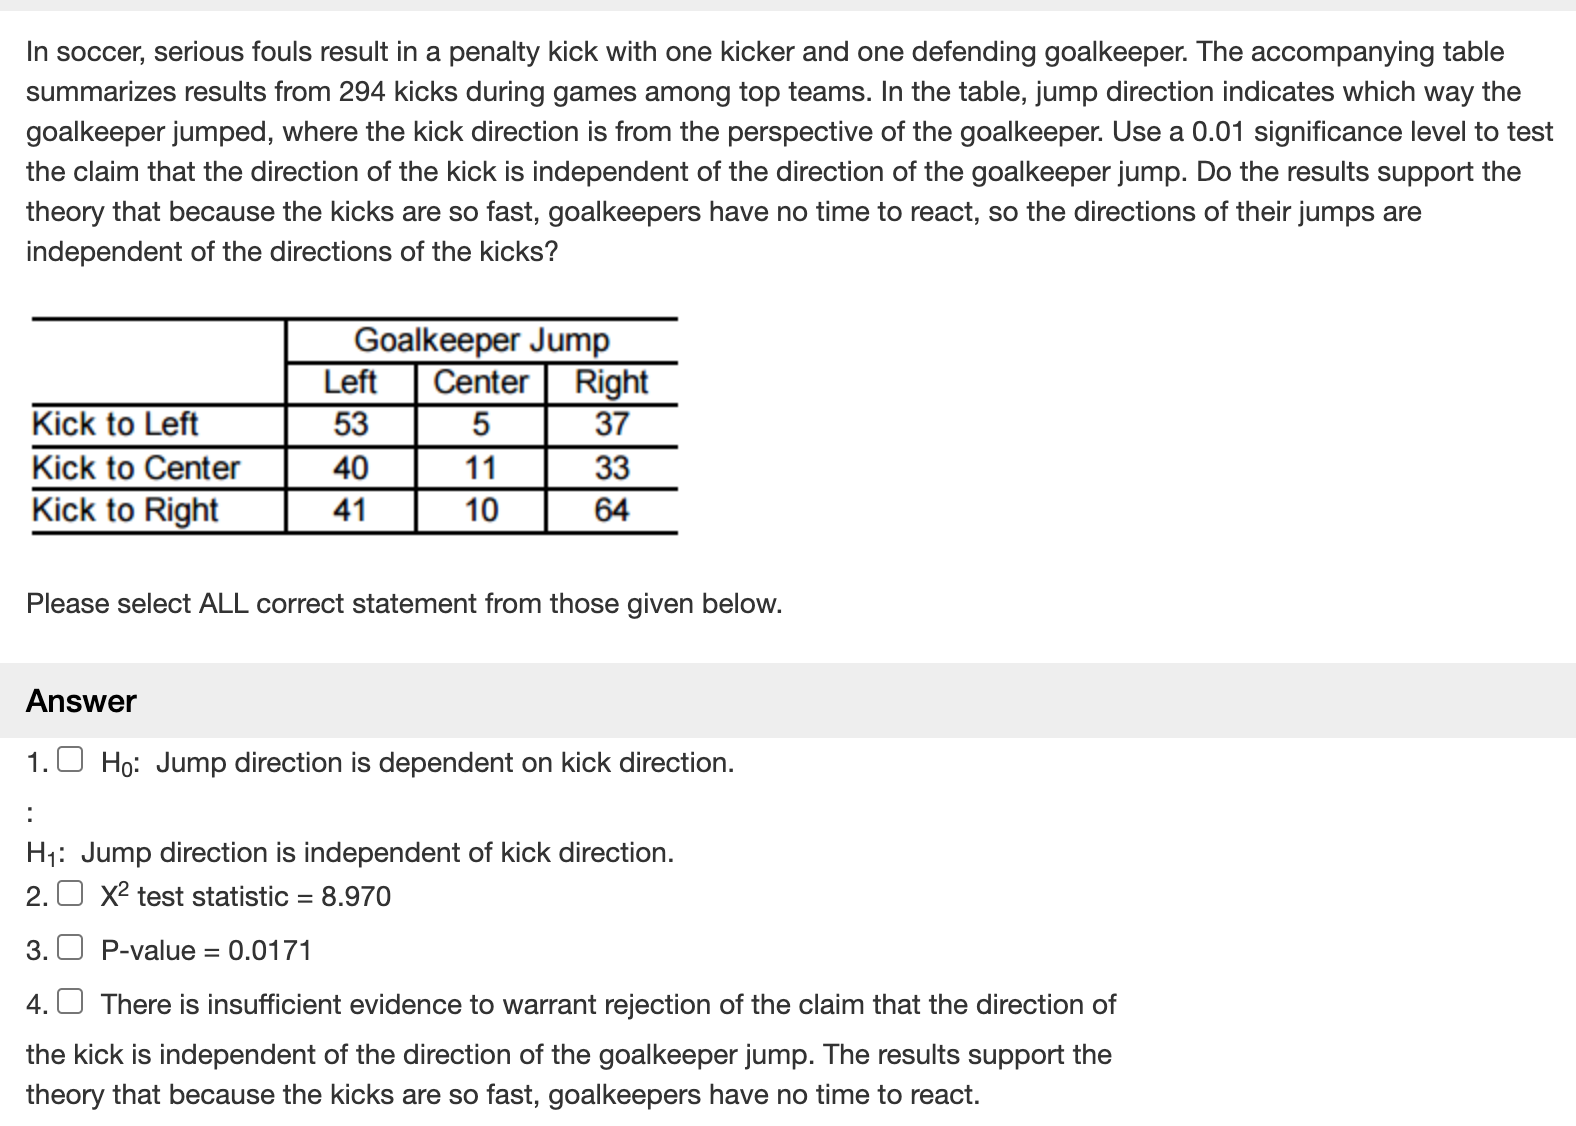
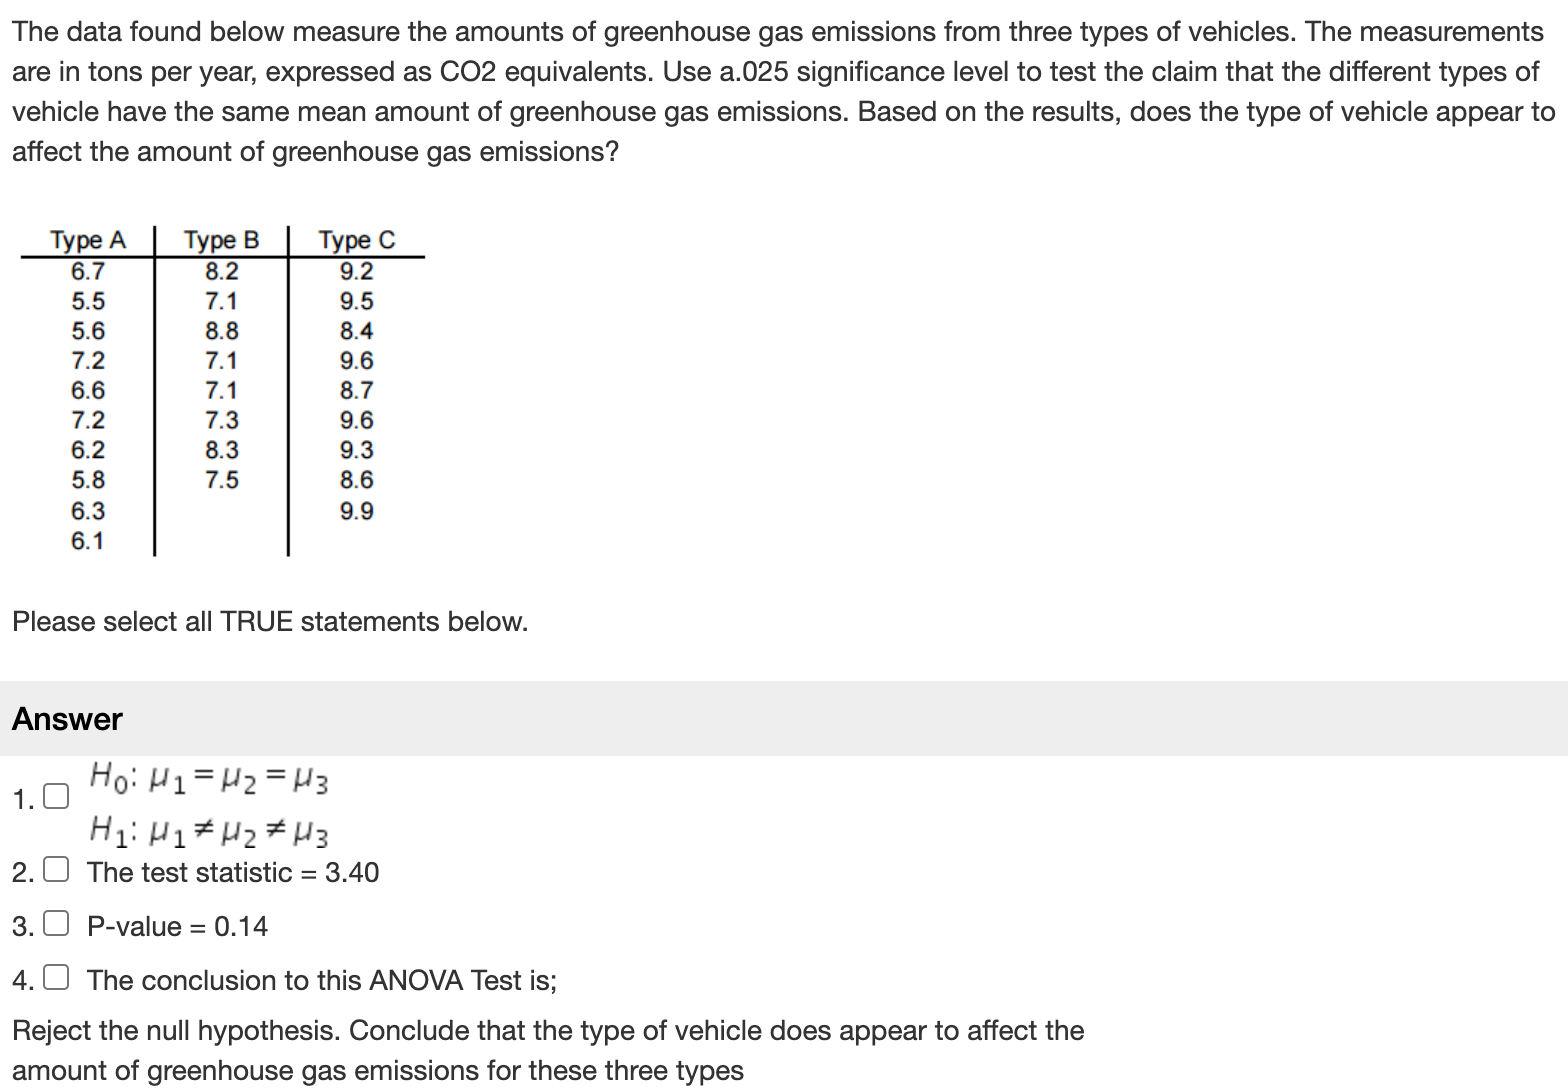
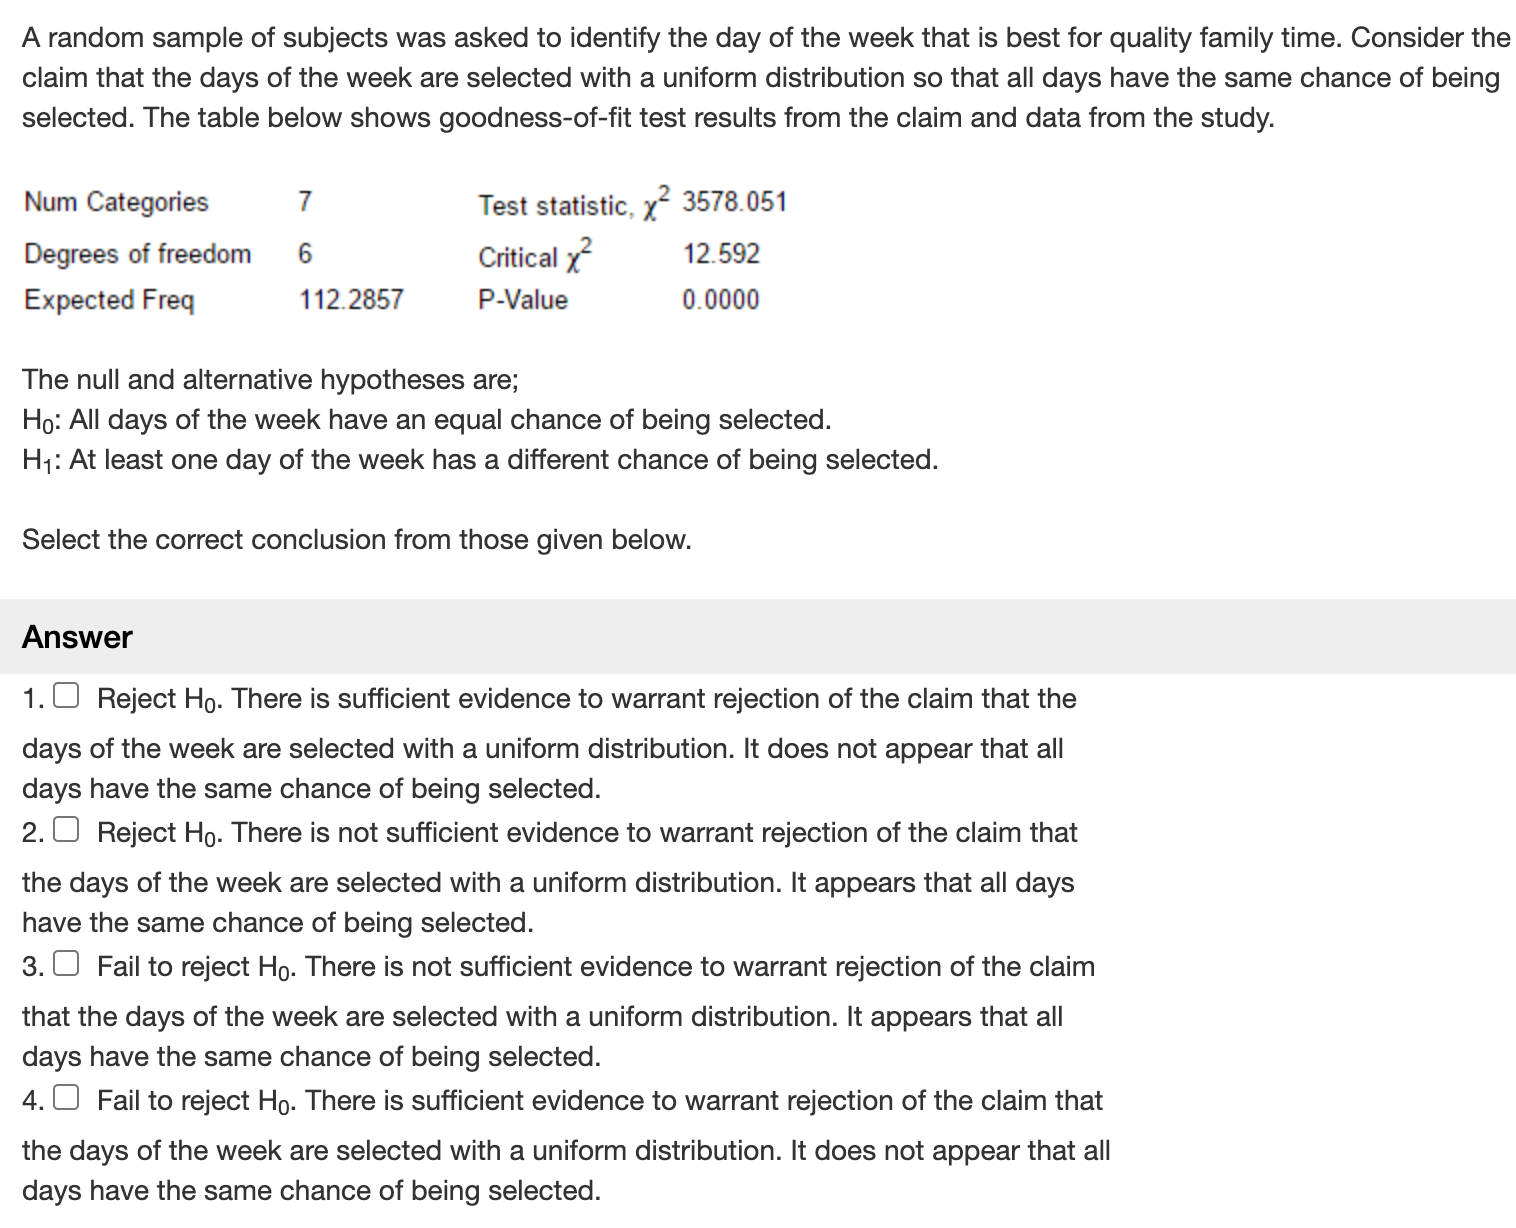
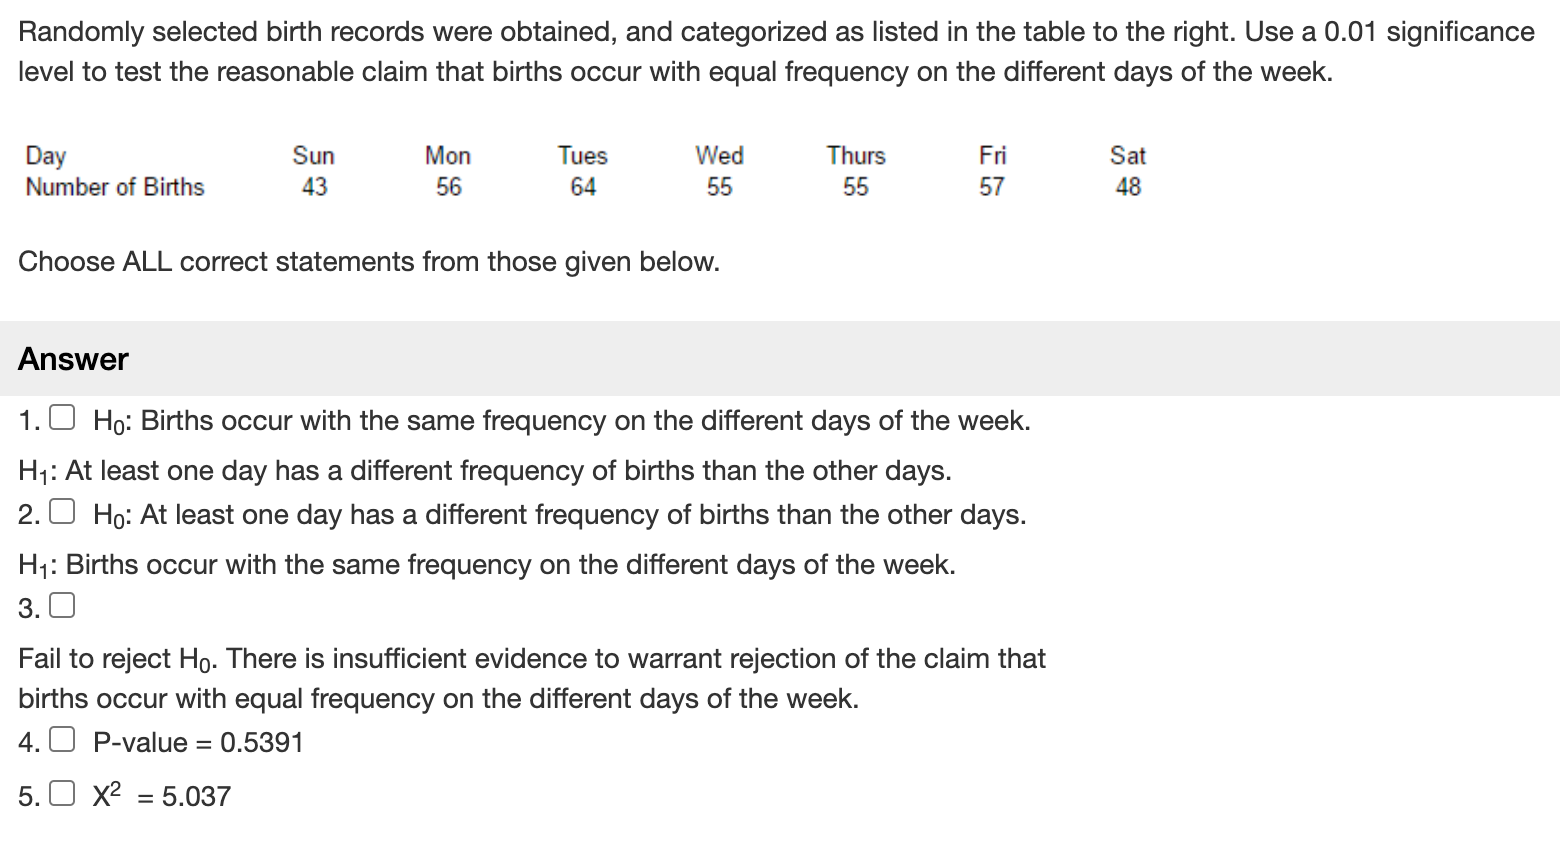
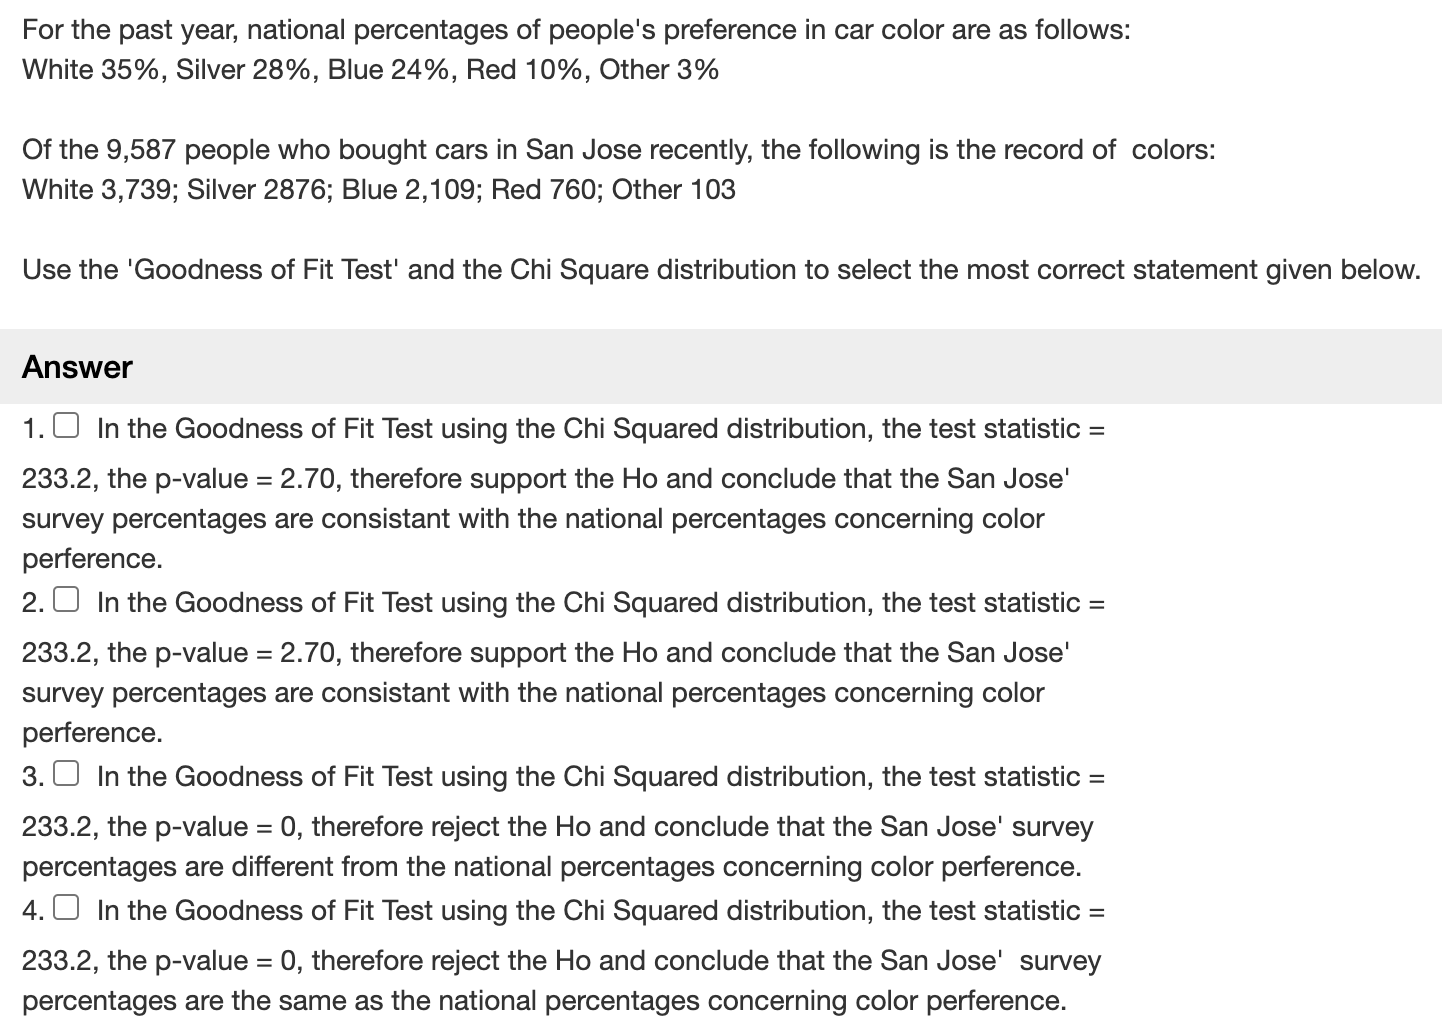
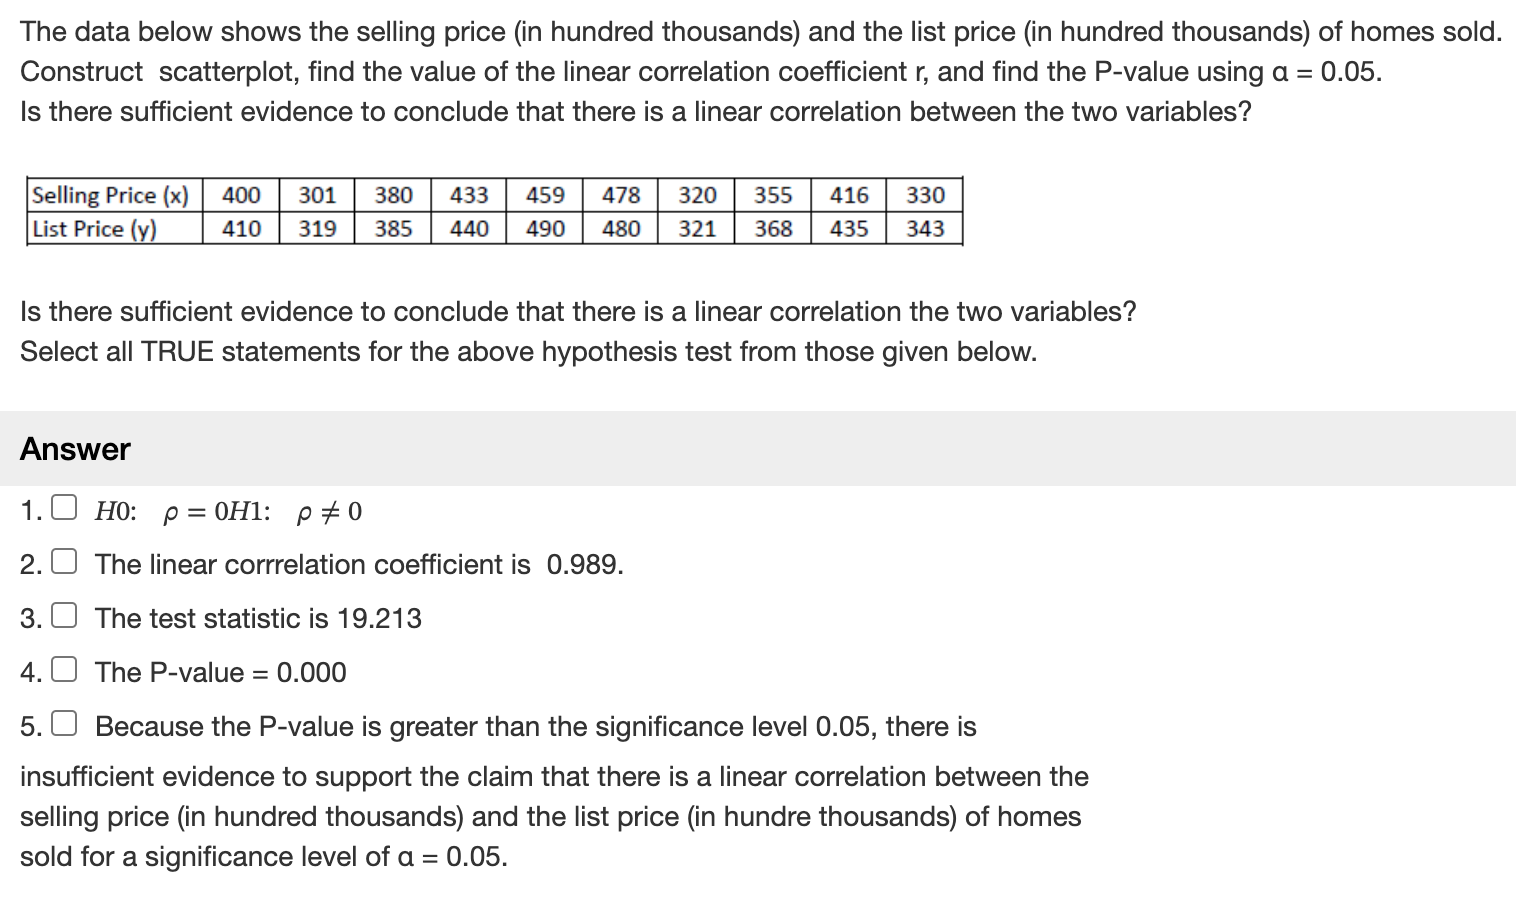
Correlation Coefficient 01 Bird species from temperate regions must cope with relatively short breeding seasons. A study examined the relationship between blood testosterone level (ng/ml) and the duration of the egg-laying period (months) in temperate bird species. The scatterplot below displays this relationship, after taking the logarithm of each variable. 1.5 10 J.5 log of testosterone level (ng/ml) 0.5 1.0 -1.5 0.0 0.2 0.4 0.6 0.8 1.0 1.2 log of duration of egg laying (month) A plausible value for the correlation between the logarithm of egg-laying duration and the logarithm of testosterone level is Answer 1.0 + 0.2 2. 0 - 0.9 3. + 0.8 4. 0 - 0.4In soccer, serious fouls result in a penalty kick with one kicker and one defending goalkeeper. The accompanying table summarizes results from 294 kicks during games among top teams. In the table, jump direction indicates which way the goalkeeper jumped, where the kick direction is from the perspective of the goalkeeper. Use a 0.01 significance level to test the claim that the direction of the kick is independent of the direction of the goalkeeper jump. Do the results support the theory that because the kicks are so fast, goalkeepers have no time to react, so the directions of their jumps are independent of the directions of the kicks? Goalkeeper Jump Kick to Left Kick to Center Kick to Right Please select ALL correct statement from those given below. Answer 1.[J Hg: Jump direction is dependent on kick direction. Hq: Jump direction is independent of kick direction. 2.[J X2 test statistic = 8.970 3.J P-value =0.0171 4.[J There is insufficient evidence to warrant rejection of the claim that the direction of the kick is independent of the direction of the goalkeeper jump. The results support the theory that because the kicks are so fast, goalkeepers have no time to react. The data found below measure the amounts of greenhouse gas emissions from three types of vehicles. The measurements are in tons per year, expressed as CO2 equivalents. Use a.025 significance level to test the claim that the different types of vehicle have the same mean amount of greenhouse gas emissions. Based on the results, does the type of vehicle appear to affect the amount of greenhouse gas emissions? Type A Type B Type C 6.7 8.2 9.2 5.5 7.1 9.5 5.6 8.8 8.4 7.2 7.1 9.6 6.6 7.1 8.7 7.2 7.3 9.6 6.2 8.3 9.3 5.8 7.5 8.6 6.3 9.9 6.1 Please select all TRUE statements below. Answer 1.0 Ho: H1= H2 = H3 H1: H1* H2* H3 2. 0 The test statistic = 3.40 3. O P-value = 0.14 4. O The conclusion to this ANOVA Test is; Reject the null hypothesis. Conclude that the type of vehicle does appear to affect the amount of greenhouse gas emissions for these three typesA random sample of subjects was asked to identify the day of the week that is best for quality family time. Consider the claim that the days of the week are selected with a uniform distribution so that all days have the same chance of being selected. The table below shows goodness-of-fit test results from the claim and data from the study. Num Categories 7 Test statistic. 12 3578.051 Degrees of freedom 6 Critical 12 12.592 Expected Freq 112.2857 P-Value 0.0000 The null and alternative hypotheses are; Ho: All days of the week have an equal chance of being selected. H;: At least one day of the week has a different chance of being selected. Select the correct conclusion from those given below. Answer 1.[J Reject Hg. There is sufficient evidence to warrant rejection of the claim that the days of the week are selected with a uniform distribution. It does not appear that all days have the same chance of being selected. 2. Reject Hy. There is not sufficient evidence to warrant rejection of the claim that the days of the week are selected with a uniform distribution. It appears that all days have the same chance of being selected. 3.[J Fail to reject Hy. There is not sufficient evidence to warrant rejection of the claim that the days of the week are selected with a uniform distribution. It appears that all days have the same chance of being selected. 4. Fail to reject Ho. There is sufficient evidence to warrant rejection of the claim that the days of the week are selected with a uniform distribution. It does not appear that all days have the same chance of being selected. Randomly selected birth records were obtained, and categorized as listed in the table to the right. Use a 0.01 significance level to test the reasonable claim that births occur with equal frequency on the different days of the week. Day Sun Mon Tues Wed Thurs Fri Sat Number of Births 43 56 64 55 55 57 43 Choose ALL correct statements from those given below. Answer 1.[J Hg: Births occur with the same frequency on the different days of the week. H1: At least one day has a different frequency of births than the other days. 2.[J Hq: At least one day has a different frequency of births than the other days. H1: Births occur with the same frequency on the different days of the week. 3.0 Fail to reject Hy. There is insufficient evidence to warrant rejection of the claim that births occur with equal frequency on the different days of the week. 4. (] P-value = 0.5391 5. X2 =5.037 For the past year, national percentages of people's preference in car color are as follows: White 35%, Silver 28%, Blue 24%, Red 10%, Other 3% Of the 9,587 people who bought cars in San Jose recently, the following is the record of colors: White 3,739; Silver 2876; Blue 2,109; Red 760; Other 103 Use the 'Goodness of Fit Test' and the Chi Square distribution to select the most correct statement given below. Answer 1.0J In the Goodness of Fit Test using the Chi Squared distribution, the test statistic = 233.2, the p-value = 2.70, therefore support the Ho and conclude that the San Jose' survey percentages are consistant with the national percentages concerning color perference. 2.[J In the Goodness of Fit Test using the Chi Squared distribution, the test statistic = 233.2, the p-value = 2.70, therefore support the Ho and conclude that the San Jose' survey percentages are consistant with the national percentages concerning color perference. 3.[J In the Goodness of Fit Test using the Chi Squared distribution, the test statistic = 233.2, the p-value = 0, therefore reject the Ho and conclude that the San Jose' survey percentages are different from the national percentages concerning color perference. 4. In the Goodness of Fit Test using the Chi Squared distribution, the test statistic = 233.2, the p-value = 0, therefore reject the Ho and conclude that the San Jose' survey percentages are the same as the national percentages concerning color perference. The data below shows the selling price (in hundred thousands) and the list price (in hundred thousands) of homes sold. Construct scatterplot, find the value of the linear correlation coefficient r, and find the P-value using a = 0.05. Is there sufficient evidence to conclude that there is a linear correlation between the two variables? Seling Price () | 400 | 301 | 380 | 433 | 459 | 478 | 320 | 355 | 416 | 330 | UstPrice(y) | 410 | 319 | 385 | 440 [ 490 | 480 | 321 | 368 [ 435 | 343 | Is there sufficient evidence to conclude that there is a linear correlation the two variables? Select all TRUE statements for the above hypothesis test from those given below. Answer 1.0J HO: p=0HL: p#0 2.[J The linear corrrelation coefficient is 0.989. 3.[J The test statistic is 19.213 4.0J The P-value = 0.000 5.[J Because the P-value is greater than the significance level 0.05, there is insufficient evidence to support the claim that there is a linear correlation between the selling price (in hundred thousands) and the list price (in hundre thousands) of homes sold for a significance level of a = 0.05
Step by Step Solution
There are 3 Steps involved in it

Get step-by-step solutions from verified subject matter experts