

Question: 1. Create a data set Create a cluster bar chart on the pH acid concentration and Brown color index . 2. Compare the two conditions,
1. Create a data set
Create a cluster bar chart on the pH acid concentration and Brown color index .
2. Compare the two conditions, which parameters are different and the same, using dF = 99% . Explain your answer. ( Using SPSS ) 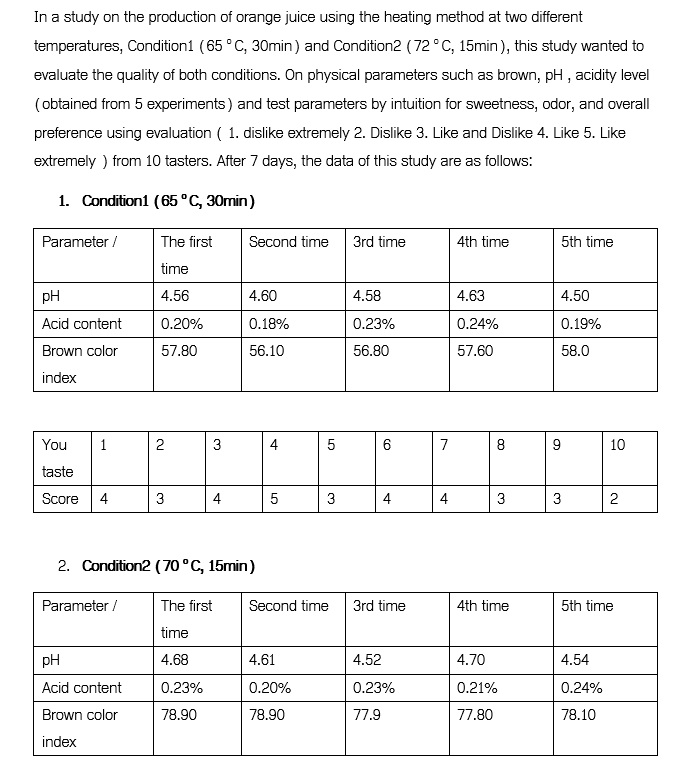
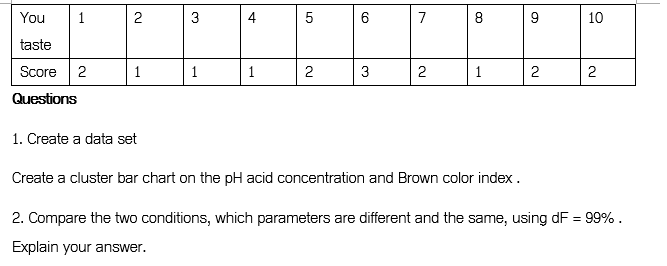
In a study on the production of orange juice using the heating method at two different temperatures, Condition1 (65 C, 30min) and Condition2 (72 C, 15min), this study wanted to evaluate the quality of both conditions. On physical parameters such as brown, pH, acidity level (obtained from 5 experiments) and test parameters by intuition for sweetness, odor, and overall preference using evaluation ( 1. dislike extremely 2. Dislike 3. Like and Dislike 4. Like 5. Like extremely ) from 10 tasters. After 7 days, the data of this study are as follows: 1. Condition1 (65 C, 30min) Parameter / The first Second time 3rd time 4th time 5th time time 4.56 4.60 4.58 4.63 4.50 0.20% 0.18% 0.23% 0.19% pH Acid content Brown color index 0.24% 57.60 57.80 56.10 56.80 58.0 You 1 2 3 5 6 7 8 9 10 taste Score 4 3 3 4 5 3 3 4 4 3 3 2. 2. Condition2 (70C, 15min) Parameter / The first Second time 3rd time 4th time 5th time time 4.68 4.61 4.52 4.70 4.54 pH Acid content 0.23% 0.20% 0.23% 0.21% 0.24% Brown color 78.90 78.90 77.9 77.80 78.10 index You 1 2 2 3 4 5 6 7 8 8 9 10 taste 1 1 1 2 3 2 1 2 2 Score 2 Questions 1. Create a data set Create a cluster bar chart on the pH acid concentration and Brown color index. = 2. Compare the two conditions, which parameters are different and the same, using df = 99%. Explain your answer. In a study on the production of orange juice using the heating method at two different temperatures, Condition1 (65 C, 30min) and Condition2 (72 C, 15min), this study wanted to evaluate the quality of both conditions. On physical parameters such as brown, pH, acidity level (obtained from 5 experiments) and test parameters by intuition for sweetness, odor, and overall preference using evaluation ( 1. dislike extremely 2. Dislike 3. Like and Dislike 4. Like 5. Like extremely ) from 10 tasters. After 7 days, the data of this study are as follows: 1. Condition1 (65 C, 30min) Parameter / The first Second time 3rd time 4th time 5th time time 4.56 4.60 4.58 4.63 4.50 0.20% 0.18% 0.23% 0.19% pH Acid content Brown color index 0.24% 57.60 57.80 56.10 56.80 58.0 You 1 2 3 5 6 7 8 9 10 taste Score 4 3 3 4 5 3 3 4 4 3 3 2. 2. Condition2 (70C, 15min) Parameter / The first Second time 3rd time 4th time 5th time time 4.68 4.61 4.52 4.70 4.54 pH Acid content 0.23% 0.20% 0.23% 0.21% 0.24% Brown color 78.90 78.90 77.9 77.80 78.10 index You 1 2 2 3 4 5 6 7 8 8 9 10 taste 1 1 1 2 3 2 1 2 2 Score 2 Questions 1. Create a data set Create a cluster bar chart on the pH acid concentration and Brown color index. = 2. Compare the two conditions, which parameters are different and the same, using df = 99%. Explain your
Step by Step Solution
There are 3 Steps involved in it

Get step-by-step solutions from verified subject matter experts