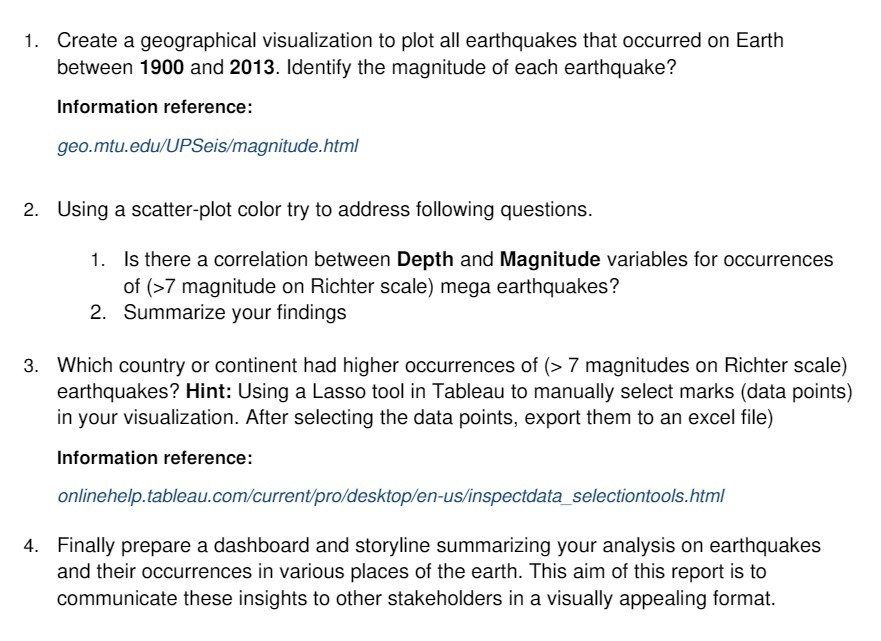
Question: 1. Create a geographical visualization to plot all earthquakes that occurred on Earth between 1900 and 2013. Identity the magnitude of each earthquake? Information reference:

1. Create a geographical visualization to plot
1. Create a geographical visualization to plot all earthquakes that occurred on Earth between 1900 and 2013. Identity the magnitude of each earthquake? Information reference: geo.mm.edu/UPSeiafmagnituo'etmf 2. Using a scatter-plot color try to address following questions. 1. Is there a correlation between Depth and Magnitude variables for occurrences of (3:? magnitude on Ftichter scale) mega earthquakes? 2. Summarize your findings 3. Which country or continent had higher occurrences of (> 7 magnitudes on Richter scale) earthquakes? Hint: Using a Lasso tool in Tableau to manually select marks (data points) in your visualization. After selecting the data points, export them to an excel file) Information reference: cnlin ehelp. tableau. comfcurrenb'profdeskfcpfen-usfinspectda ta_sefectr'ontoofs. him! 4. Finally prepare a dashboard and storyline summarizing your analysis on earthquakes and their occurrences in various places of the earth. This aim of this report is to communicate these insights to other stakeholders in a visually appealing format

Step by Step Solution

There are 3 Steps involved in it

1 Expert Approved Answer
Step: 1 Unlock blur-text-image
Question Has Been Solved by an Expert!

Get step-by-step solutions from verified subject matter experts

Step: 2 Unlock
Step: 3 Unlock

Students Have Also Explored These Related Mathematics Questions!