

Question: 1 . Create a heat map chart for the data. 2 . Consider ways to perform a visual check to see if there is a
Create a heat map chart for the data.
Consider ways to perform a visual check to see if there is a relationship between fields.
With this insight, develop a model using either linear regression or multiple linear regression.
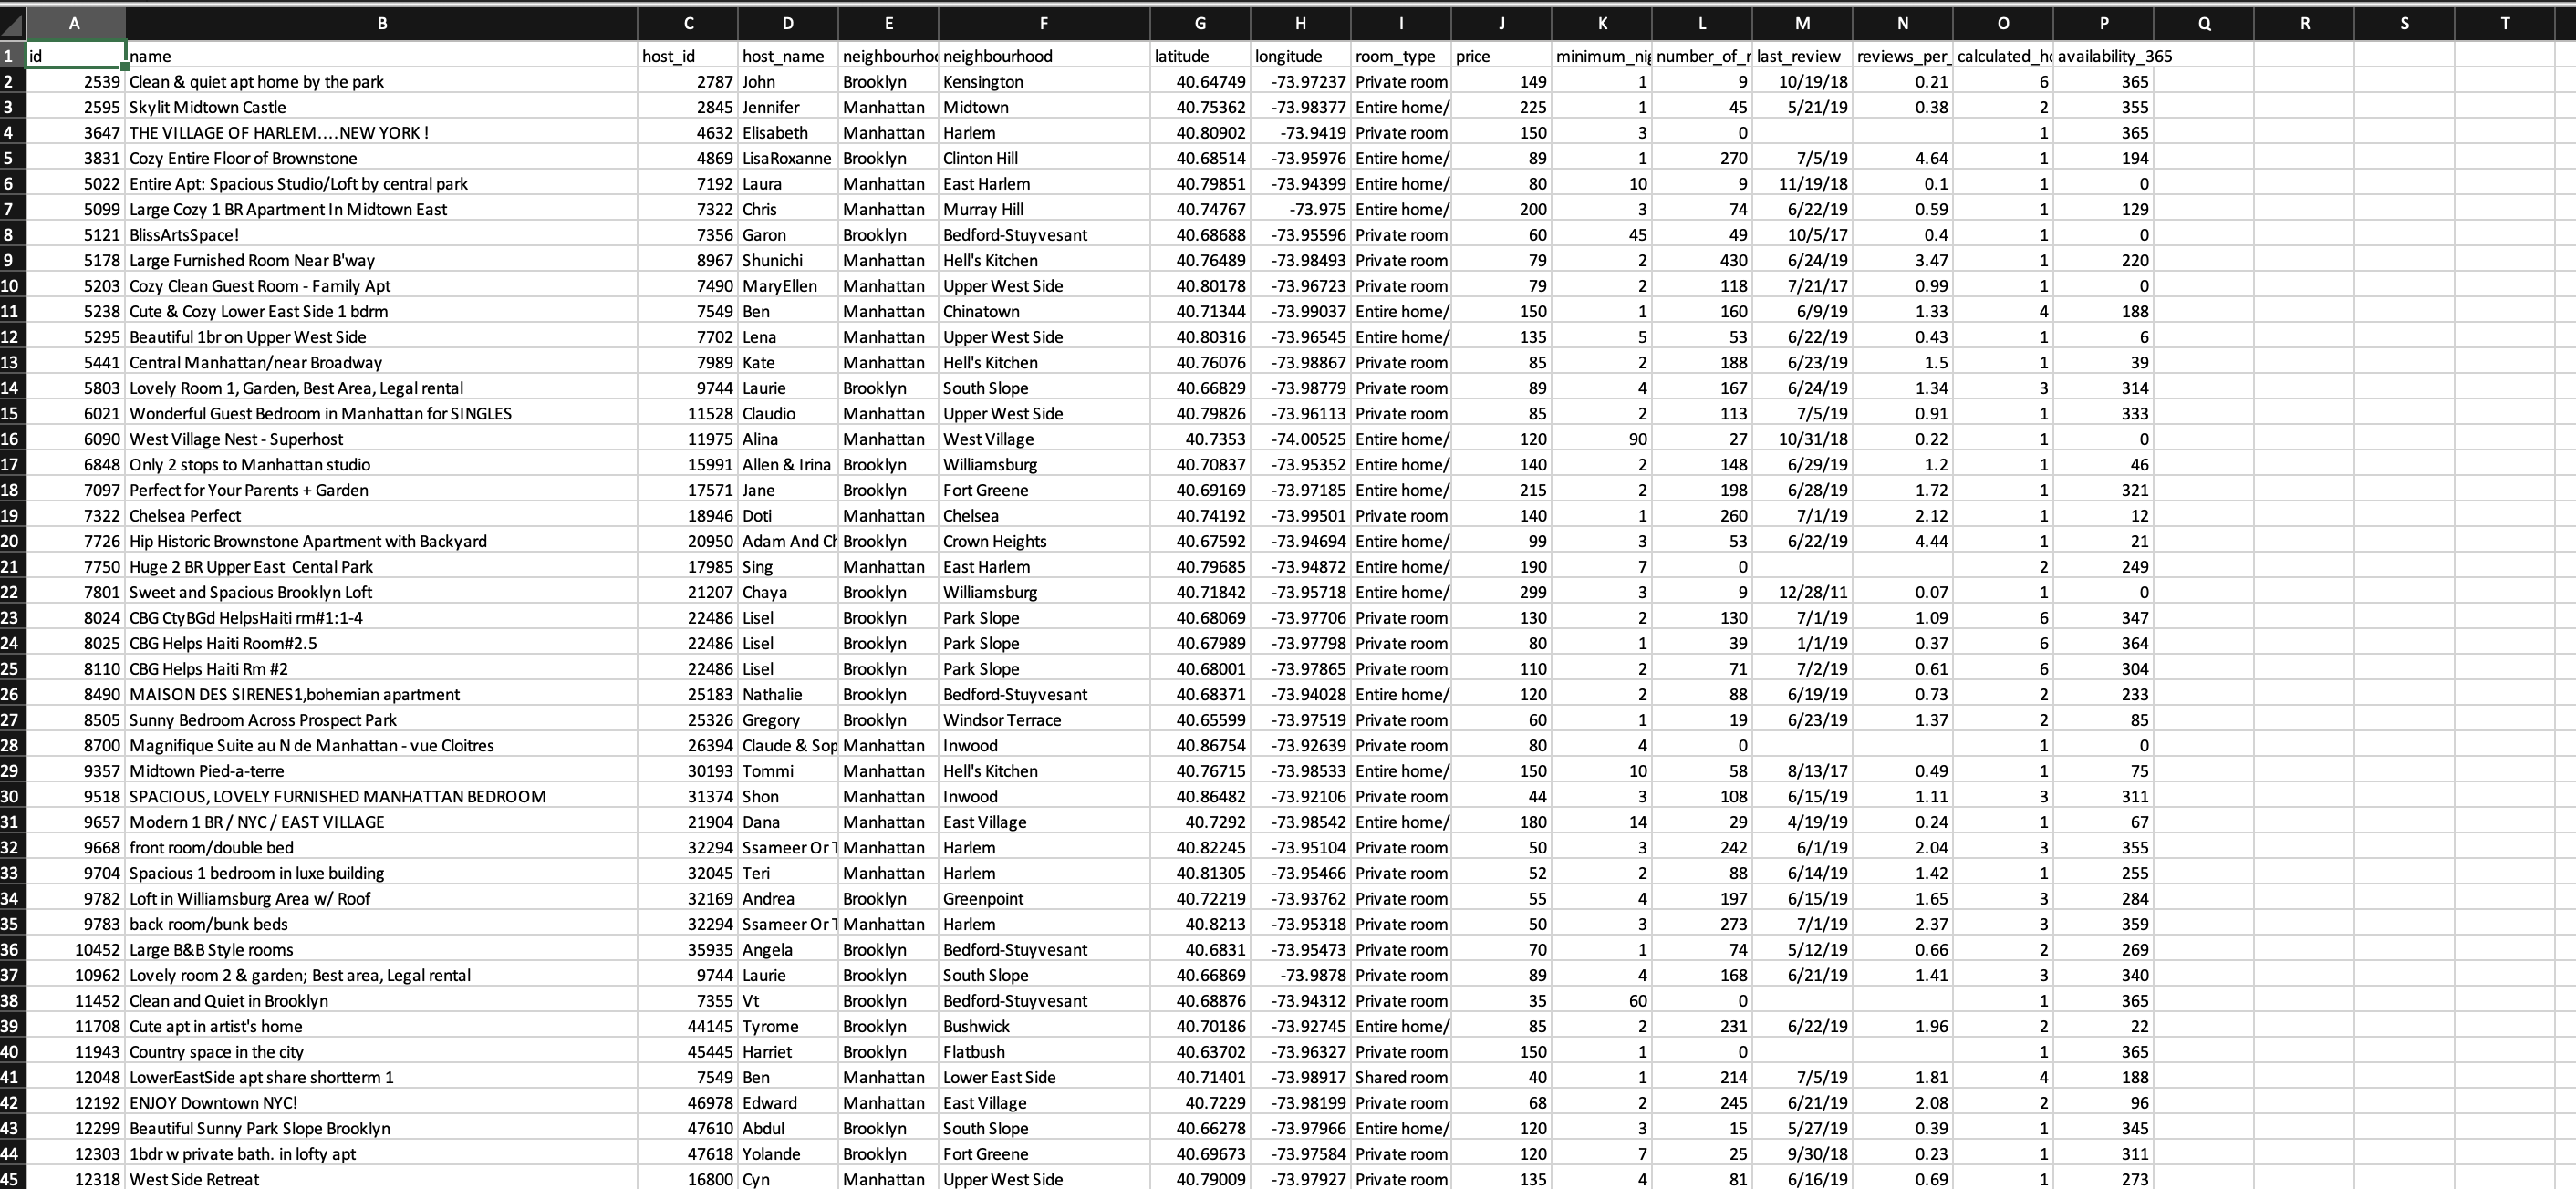
Report the intercepts, slope, model accuracy, output to predicted comparison, and a scatterplot with line portraying the model. Please give the code for python jupyter. I CANNOT UPLOAD ANY COPYABLE DATA JUST A SCREENSHOT.
Step by Step Solution
There are 3 Steps involved in it
1 Expert Approved Answer
Step: 1 Unlock

Question Has Been Solved by an Expert!
Get step-by-step solutions from verified subject matter experts
Step: 2 Unlock
Step: 3 Unlock