

Question: 1 . Create a new file hw 1 1 . py . 2 . Add a docstring with your name and surname on top. 3
Create a new file hwpy
Add a docstring with your name and surname on top.
Copy all sorting functions from the lecture code lines file Sorting.py
Install Matplotlib:
To install Matplotlib, you can use the following command in your terminal or command prompt, depending on your Python environment. Open your terminal or command prompt and type:
pip install matplotlib
This command uses the Python package manager pip to download and install the Matplotlib library. Make sure you have a working internet connection, and the installation should proceed without any issues.
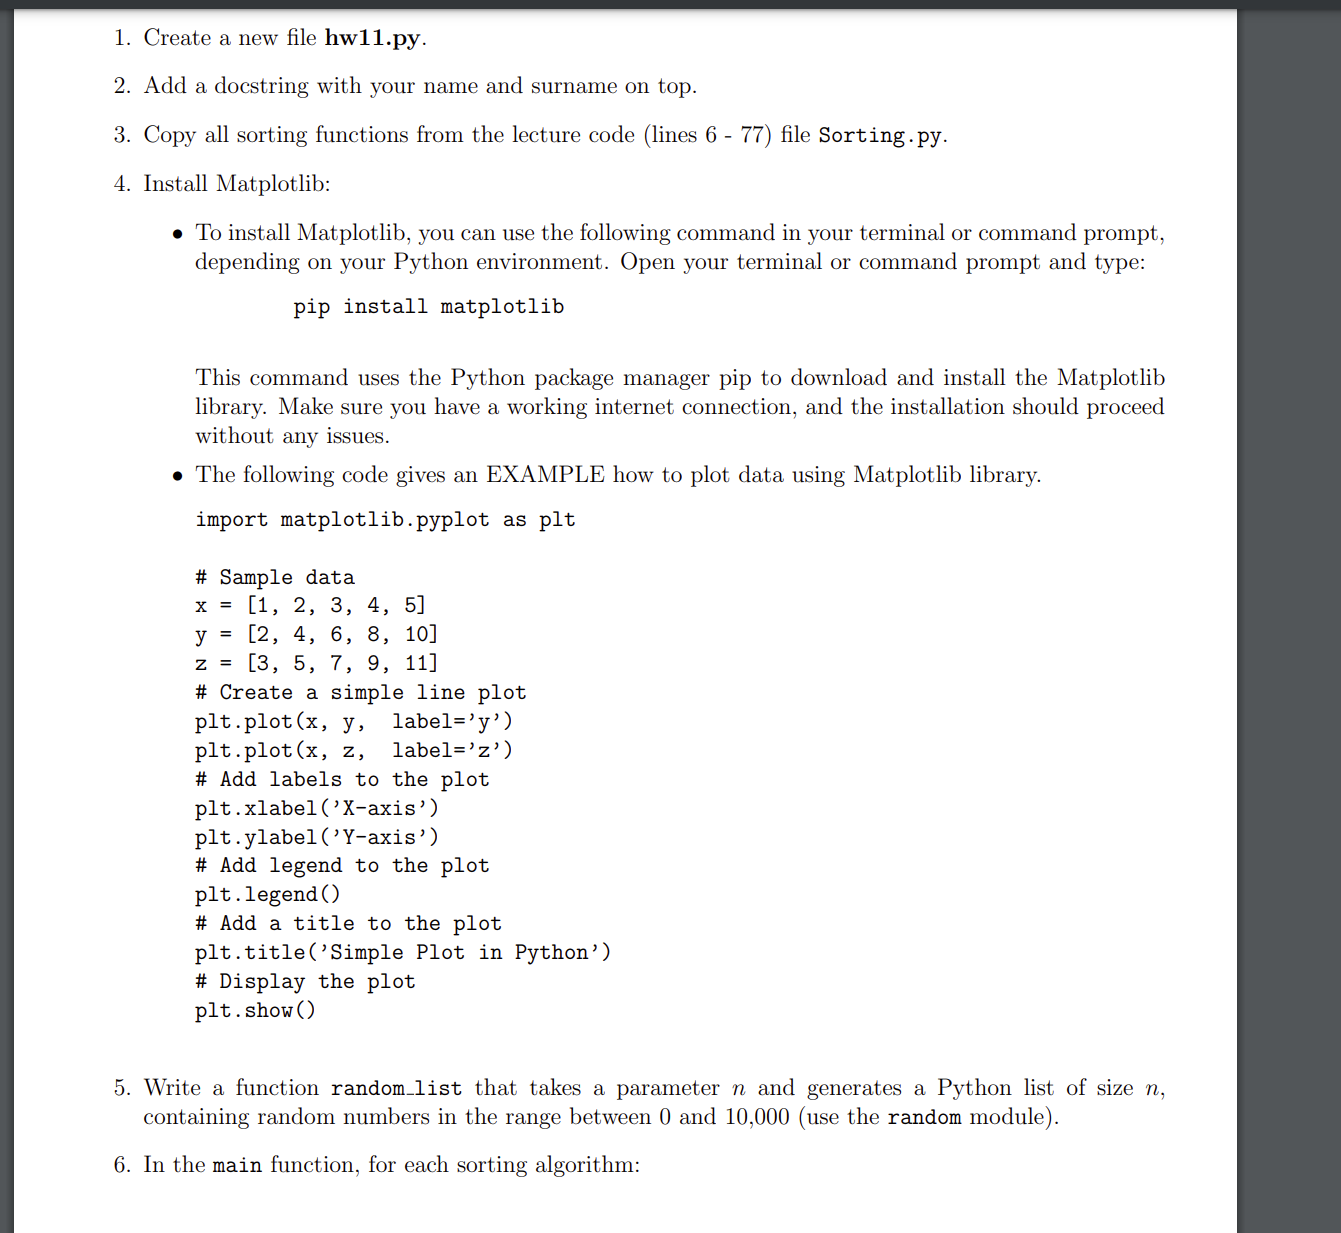
The following code gives an EXAMPLE how to plot data using Matplotlib library.
import matplotlib.pyplot as plt
# Sample data
x
y
z
# Create a simple line plot
pltplotx y labely
pltplotx z labelz
# Add labels to the plot
pltxlabelXaxis'
pltylabelYaxis'
# Add legend to the plot
pltlegend
# Add a title to the plot
plttitleSimple Plot in Python'
# Display the plot
pltshow
Write a function randomlist that takes a parameter n and generates a Python list of size n containing random numbers in the range between and use the random module
In the main function, for each sorting algorithm: Use the randomlist function to generate random lists of integers with the following sizes: and
Note: You must generate new lists for each sorting algorithm because lists in Python are mutable. If you sort a list with one algorithm, the next algorithm would work on an already sorted list.
Use the time module in Python to measure the running time for each algorithm and list size import time
Measure and record the running time of each sorting algorithm for every list size. Store the running times in a list.
Create a plot to visualize the running time of each algorithm with respect to the size of the input list. Your plot should include:
A title as shown in the example
Xaxis label
Yaxis label
A legend
Example plot for reference:
Step by Step Solution
There are 3 Steps involved in it
1 Expert Approved Answer
Step: 1 Unlock

Question Has Been Solved by an Expert!
Get step-by-step solutions from verified subject matter experts
Step: 2 Unlock
Step: 3 Unlock