

Question: 1 . Create a period number column and columns for seasonal indexes, to use for a seasonalized linear regression forecasting model. 2 . Use TREND
Create a period number
column and columns for seasonal indexes, to use for a seasonalized linear regression forecasting model.
Use TREND with the data from the first weeks to generate a seasonalized, trendincluding forecast for Production for weeks through
Compute MSE and MAPE for the forecast compared to actual in weeks through
MSE
Draw a line chart that shows the historical data and the forecast.
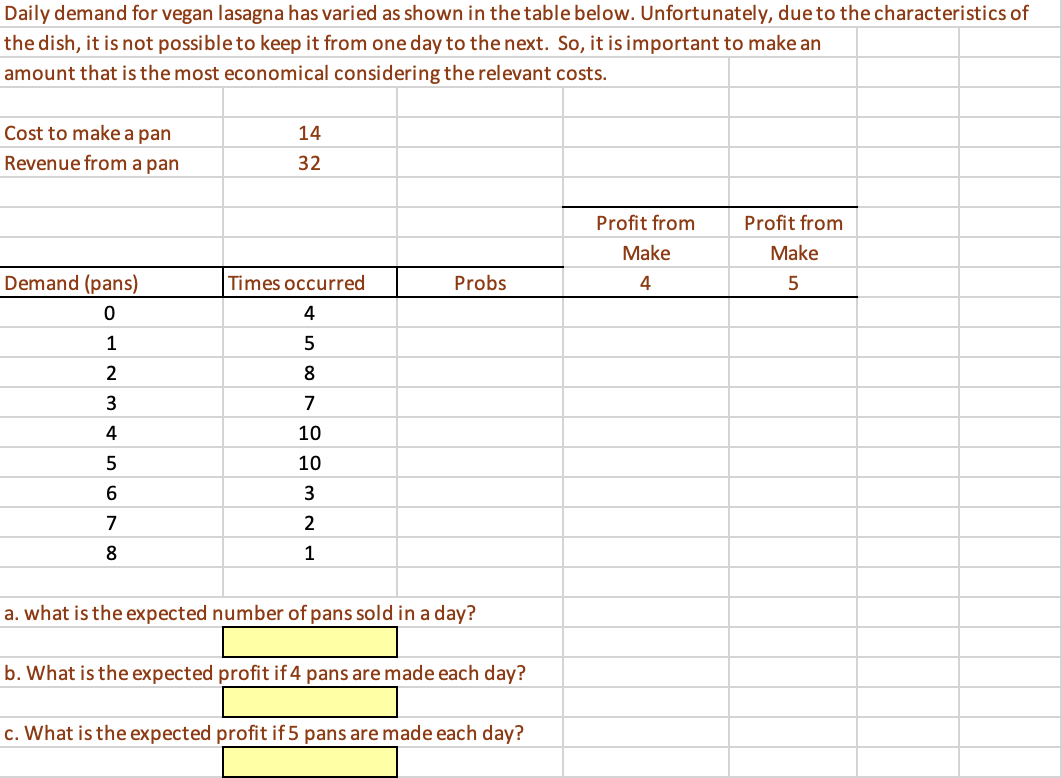
put graph below here. In this problem, you are going to try a linear fit forecast as we covered in class and then a simple modification that we did not cover in class. In column C create a linear forecast using the period number as the predictor. Use all data points for the TREND. Then in column D starting in period use a linear fit that uses the previous actuals for the y range and the previous period numbers for the x values. In the TREND function, you will not have absolute cell references for this. Then copy this down to period Draw a graph that shows the actuals and the two forecasts. What do you think about the modified forecast method? Daily demand for vegan lasagna has varied as shown in the table below. Unfortunately, due to the characteristics of the dish, it is not possible to keep it from one day to the next. So it is important to make an amount that is the most economical considering the relevant costs.
a what is the expected number of pans sold in a day?
b What is the expected profit if pans are made each day?
c What is the expected profit if pans are made each day?
Step by Step Solution
There are 3 Steps involved in it
1 Expert Approved Answer
Step: 1 Unlock

Question Has Been Solved by an Expert!
Get step-by-step solutions from verified subject matter experts
Step: 2 Unlock
Step: 3 Unlock