

Question: 1 . Create a period number column and columns for seasonal indexes, to use for a seasonalized linear regression forecasting model. 2 . Use TREND
Create a period number
column and columns for seasonal indexes, to use for a seasonalized linear regression forecasting model.
Use TREND with the data from the first weeks to generate a seasonalized, trendincluding forecast for Production for weeks through
Compute MSE and MAPE for the forecast compared to actual in weeks through
MSE
Draw a line chart that shows the historical data and the forecast.
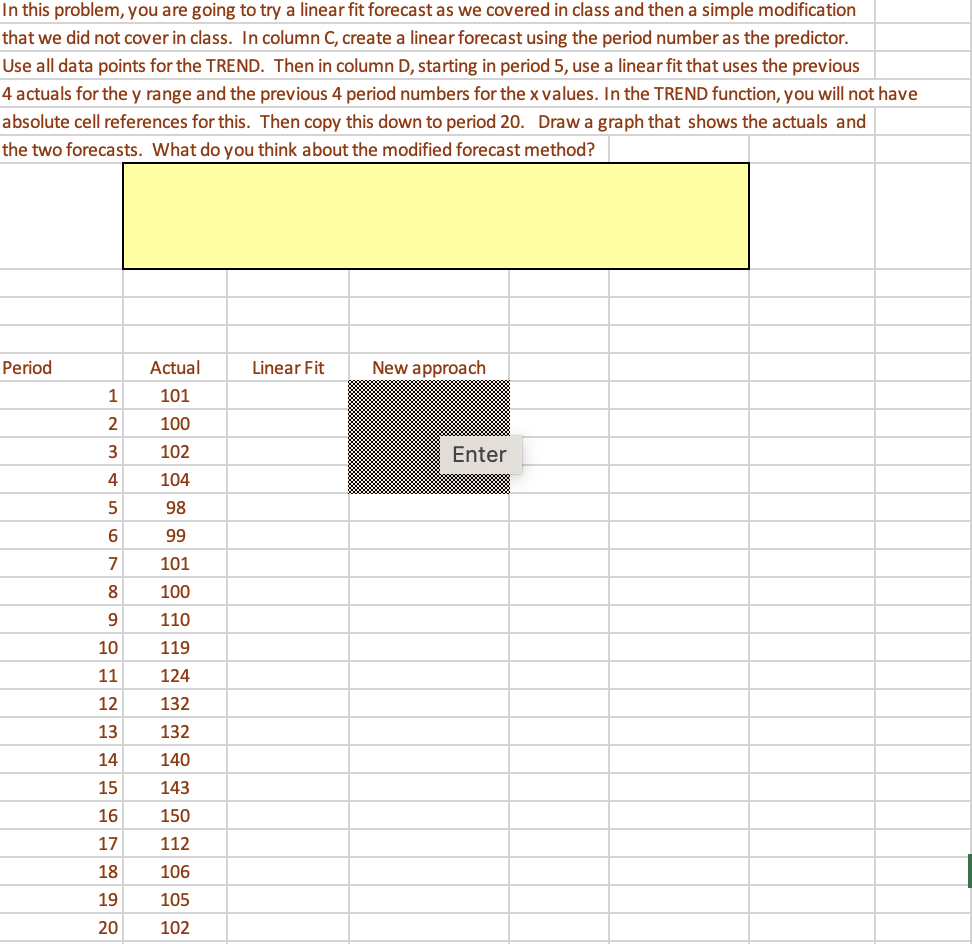
put graph below here. In this problem, you are going to try a linear fit forecast as we covered in class and then a simple modification that we did not cover in class. In column C create a linear forecast using the period number as the predictor. Use all data points for the TREND. Then in column D starting in period use a linear fit that uses the previous actuals for the y range and the previous period numbers for the x values. In the TREND function, you will not have absolute cell references for this. Then copy this down to period Draw a graph that shows the actuals and the two forecasts. What do you think about the modified forecast method?
Step by Step Solution
There are 3 Steps involved in it
1 Expert Approved Answer
Step: 1 Unlock

Question Has Been Solved by an Expert!
Get step-by-step solutions from verified subject matter experts
Step: 2 Unlock
Step: 3 Unlock