

Question: 1 Create the network topology shown below (also known as dumbbell topology). In the figure, every circle represents a node, while lines represent links All
1
Create the network topology shown below (also known as dumbbell topology). In the figure, every circle represents a node, while lines represent links
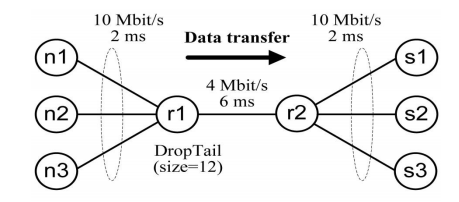
All the links are 10 Mbit/s full-duplex links with 2 ms delay, except for the link between r1-r2: it is 4 Mbit/s full-duplex link with 6 ms delay. Thus, the link r1-r2 is a bottleneck link. The queuing discipline of all links is DropTail (FIFO). Limit the maximum queue size at r1-r2 link to 12 packets. Attach one-way TCP senders to the nodes n1, n2, and n3. Use TCP Tahoe agent at n1, TCP Reno at n2, and TCP NewReno (Slow-but-Steady variant) at n3 node.
Use the following TCP parameters:
#TCP Tahoe parameters
Agent/TCP set maxcwnd_ 20
Agent/TCP set windowInit_ 2
Agent/TCP set packetSize_ 1460
Agent/TCP set tcpTick_ 0.001
#TCP Reno parameters
Agent/TCP/Reno set maxcwnd_ 20
Agent/TCP/Reno set windowInit_ 2
Agent/TCP/Reno set packetSize_ 1460
Agent/TCP/Reno set tcpTick_ 0.001
#TCP NewReno parameters (Slow-but-Steady)
Agent/TCP/Newreno set maxcwnd_ 20
Agent/TCP/Newreno set windowInit_ 2
Agent/TCP/Newreno set packetSize_ 1460
Agent/TCP/Newreno set tcpTick_ 0.001
Agent/TCP/Newreno set newreno_changes_ 0
Agent/TCP/Newreno set newreno_changes1_ 0
Let the sink for source n1 be s1, the sink for n2 be s2, and the sink for n3 be s3.
Use Agent/TCPSink as a TCP receiver. Set different colors for data flows as we did for previous assignment. Generate TCP traffic using FTP application.
Start sending data from all sources at the same time (time 0sec) , and stop each flow after 4 seconds, i.e. the duration of the simulation is 4 seconds
2
Trace evolution of congestion window size of TCP Tahoe/Reno/NewReno senders and plot a graph, where the values of Tahoe/Reno/NewReno windows are on the y-axis and x-axis is time line. You can get the values of cwnd by using $tcp trace cwnd_ command and import them into Excel, Mathcad or any other mathematical program, or plot a graph using xgraph utility.
On a base of simulation results (provide the graph), comment on the difference between these types of TCP senders (Tahoe/Reno/NewReno). See RFC 2001, RFC 2581, and RFC 3782 for details.
3
Monitor the behavior of the network using nam. You should observe packet drops in the queue of the bottleneck link. Write down the time when the first four packet drops occur. Also define which TCP sender(s) sent these packets. Note that running the script generates a nam trace file that is used as an input to network animator and can be used for simulation analysis. Each trace line starts with an event (+, -, d, r) descriptor followed by the simulation time (in seconds) of that event. Therefore, it is possible to select all trace lines corresponding to packet drops by performing search for lines starting with d -t:
4
TCP congestion control will gradually eliminate the congestion, and the queue will become empty. Record the time(s) when it happens.
Tip: Do not forget to declare the trace file queue within the finish procedure.
5
Run a simulation to study the fairness of TCP version by drawing the instantaneous throughput of the three sessions against time (use 0.1 time window) ON ONE graph. Start traffic from n1, n2, and n3, at times 0, .5 second, and 1 second respectively.
10 Mbit/s 2 ms 10 Mbit/s 2 ms Data transfer n1 4 Mbit/s 6 ms n2 r1 r2 s2 DropTail (size-12) n3 S3
Step by Step Solution
There are 3 Steps involved in it

Get step-by-step solutions from verified subject matter experts