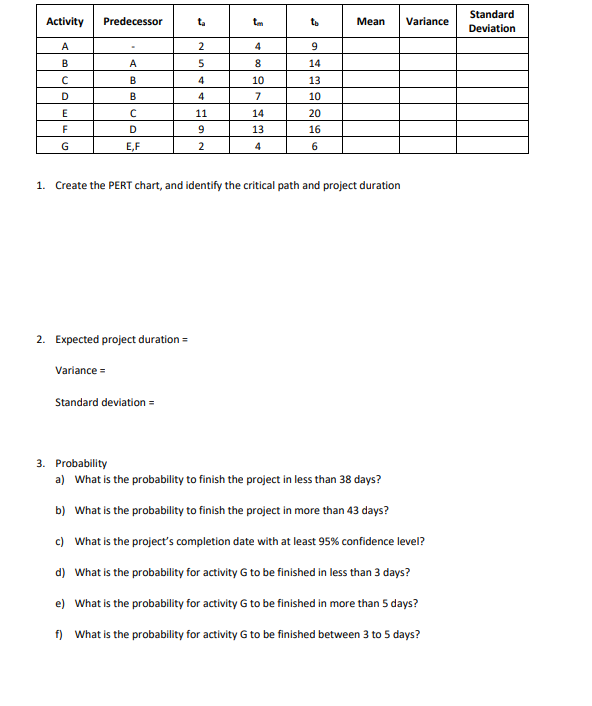
Question: 1. Create the PERT chart, and identify the critical path and project duration 2. Expected project duration = Variance = Standard deviation = 3. Probability

1. Create the PERT chart, and identify the

1. Create the PERT chart, and identify the critical path and project duration 2. Expected project duration = Variance = Standard deviation = 3. Probability a) What is the probability to finish the project in less than 38 days? b) What is the probability to finish the project in more than 43 days? c) What is the project's completion date with at least 95% confidence level? d) What is the probability for activity G to be finished in less than 3 days? e) What is the probability for activity G to be finished in more than 5 days? f) What is the probability for activity G to be finished between 3 to 5 days

Step by Step Solution

There are 3 Steps involved in it

1 Expert Approved Answer
Step: 1 Unlock blur-text-image
Question Has Been Solved by an Expert!

Get step-by-step solutions from verified subject matter experts

Step: 2 Unlock
Step: 3 Unlock

Students Have Also Explored These Related General Management Questions!