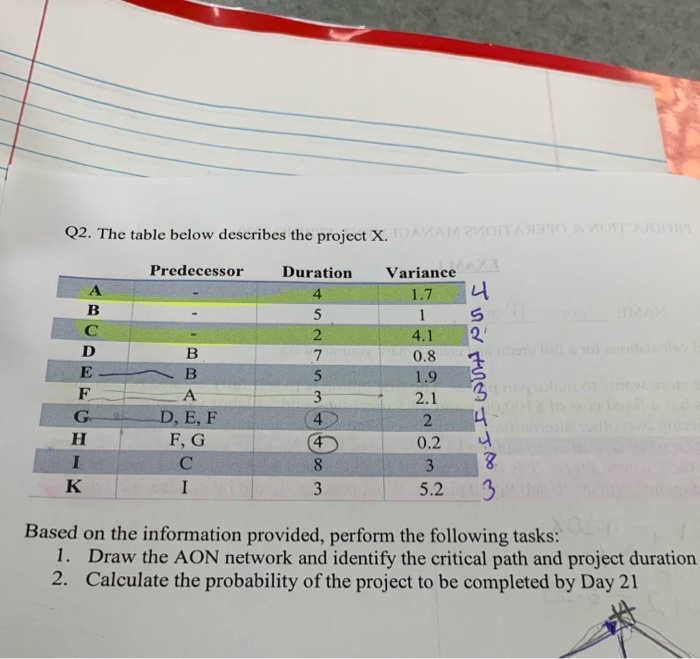
Question: Q2. The table below describes the project X Predecessor Duration Variance 1.7 4 c na tu F A 0.8 1.9 2.1 G D, E, F

Q2. The table below describes the project X
Q2. The table below describes the project X Predecessor Duration Variance 1.7 4 c na tu F A 0.8 1.9 2.1 G D, E, F F G 0.2 IC 838 KI 5.2 3 a . Based on the information provided, perform the following tasks: 1. Draw the AON network and identify the critical path and project duration 2. Calculate the probability of the project to be completed by Day 21

Step by Step Solution

There are 3 Steps involved in it

1 Expert Approved Answer
Step: 1 Unlock blur-text-image
Question Has Been Solved by an Expert!

Get step-by-step solutions from verified subject matter experts

Step: 2 Unlock
Step: 3 Unlock

Students Have Also Explored These Related General Management Questions!