

Question: 1. Develop 3 sigma level process control charts for monitoring weight of boxes that contain apples. You performed samplings over 5 weeks with sample
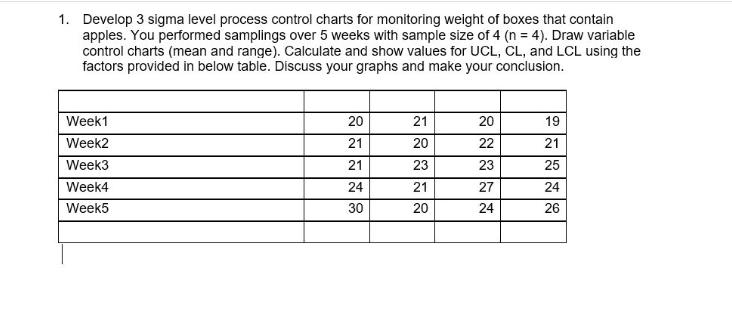
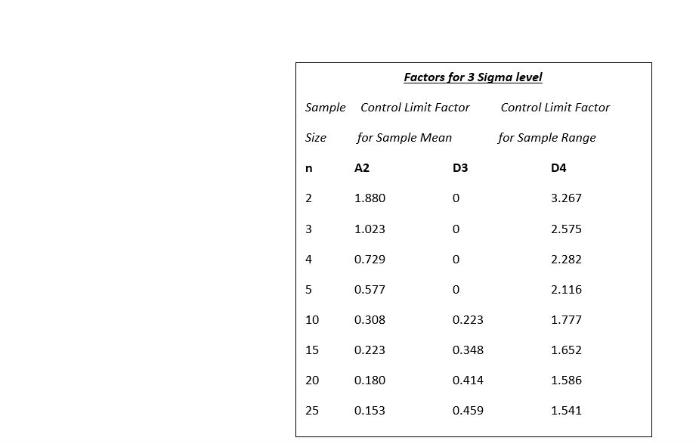
1. Develop 3 sigma level process control charts for monitoring weight of boxes that contain apples. You performed samplings over 5 weeks with sample size of 4 (n = 4). Draw variable control charts (mean and range). Calculate and show values for UCL, CL, and LCL using the factors provided in below table. Discuss your graphs and make your conclusion. Week1 Week2 Week3 Week4 Week5 20 21 21 24 30 21 20 23 21 20 20 22 23 27 24 19 21 25 24 26 Sample Size n 2 3 4 5 10 15 20 25 Control Limit Factor for Sample Mean A2 1.880 1.023 0.729 0.577 0.308 0.223 Factors for 3 Sigma level 0.180 0.153 D3 0 0 0 0 0.223 0.348 0.414 0.459 Control Limit Factor for Sample Range D4 3.267 2.575 2.282 2.116 1.777 1.652 1.586 1.541
Step by Step Solution
There are 3 Steps involved in it
To develop the variable control charts mean and range for monitoring the weight of boxes containing apples well use the provided data from the 5 weeks ... View full answer

Get step-by-step solutions from verified subject matter experts