

Question: 2) Develop 3 sigma level process control charts for monitoring weight of boxes that contain watermelons. You performed samplings over 5 weeks with sample size
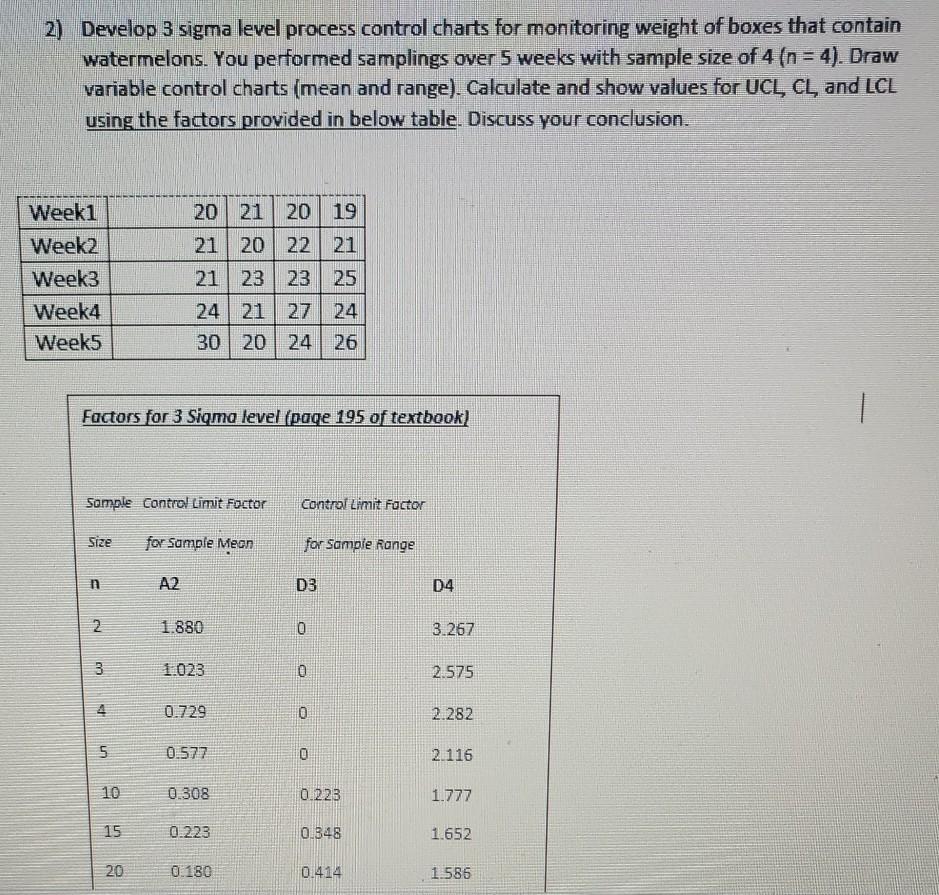
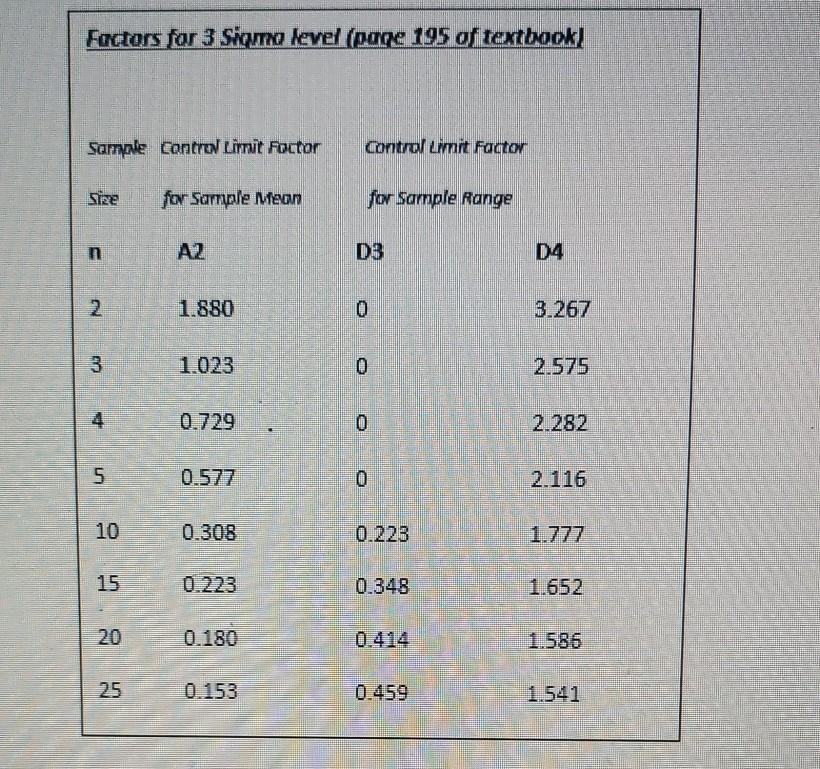
2) Develop 3 sigma level process control charts for monitoring weight of boxes that contain watermelons. You performed samplings over 5 weeks with sample size of 4 (n = 4). Draw variable control charts (mean and range). Calculate and show values for UCL, CL, and LCL using the factors provided in below table. Discuss your conclusion. Week1 Week2 Week3 Week4 Week5 20 21 20 19 21 20 22 21 21 23 23 25 24 21 27 24 30 20 24 26 Factors for 3 Sigma level (page 195 of textbook) . Sample Control Litut Foctor Control Limit Factor Size for Sample Mean for Sample Range A2 D3 D4 2 1.880 0 3.267 3 1023 0 2.575 4 A 0.729 0 2.282 5 0.577 0 2.116 10 0.308 0.223 1.777 15 0.223 0.348 1.652 20 0.180 0.414 1.586 Factors for 3 Sigurno level (page 195 of textbook) Sample contre circuit Factor Control Limit Factor Size for Sample Meon for Sample Range n AZ D3 D4 NU 1.880 0 3.267 3 CYJ 1023 0 2.575 4 0.729 0 2.282 un 0.577 0 2.116 10 0.308 0.223 1.777 15 0.348 1.652 0.180 1.586 25 0.153 0.459 1.541
Step by Step Solution
There are 3 Steps involved in it
1 Expert Approved Answer
Step: 1 Unlock

Question Has Been Solved by an Expert!
Get step-by-step solutions from verified subject matter experts
Step: 2 Unlock
Step: 3 Unlock