

Question: 1. Draft a PERT Chart (follow figure in pic). 2. Calculate the total time necessary from start to finish. PERT chart Start Finish e 5
1. Draft a PERT Chart (follow figure in pic). 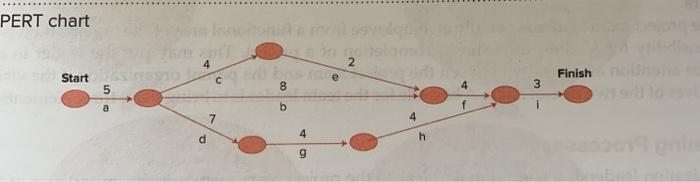
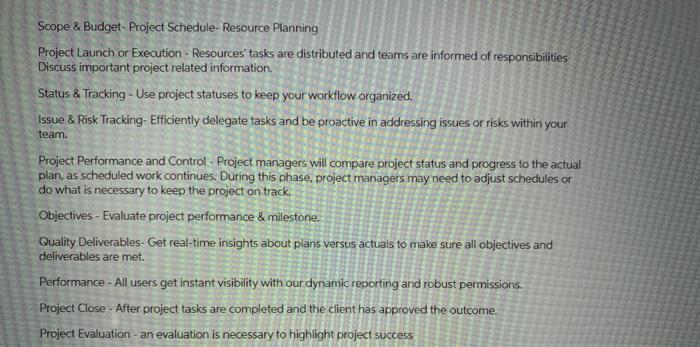
PERT chart Start Finish e 5 8 4 3 a b 7 4 4 d h 9 Scope & Budget- Project Schedule - Resource Planning Project Launch or Execution - Resources' tasks are distributed and teams are informed of responsibilities Discuss important project related information Status & Tracking - Use project statuses to keep your workflow organized. Issue & Risk Tracking-Efficiently delegate tasks and be proactive in addressing issues or risks within your team. Project Performance and Control - Project managers will compare project status and progress to the actual plan, as scheduled work continues. During this phase, project managers may need to adjust schedules or do what is necessary to keep the project on track. Objectives - Evaluate project performance & milestone. Quality Deliverables- Get real-time insights about plans versus actuals to make sure all objectives and deliverables are met. Performance - All users get instant visibility with our dynamic reporting and robust permissions. Project Close After project tasks are completed and the client has approved the outcome. Project Evaluation - an evaluation is necessary to highlight project success
2. Calculate the total time necessary from start to finish.
Step by Step Solution
There are 3 Steps involved in it
1 Expert Approved Answer
Step: 1 Unlock

Question Has Been Solved by an Expert!
Get step-by-step solutions from verified subject matter experts
Step: 2 Unlock
Step: 3 Unlock