

Question: QUESTION 1 Based on the information below: a. Develop a CPM tabular report b. Draw a schedule Gantt Chart, including the activity float c. What
QUESTION 1
Based on the information below:
- a. Develop a CPM tabular report
- b. Draw a schedule Gantt Chart, including the activity float
- c. What is the minimum time to complete this project?
- d. What is the project end date?
- e. What is the critical path (if any)?
- f. If you only had one resource to your disposal, which days would have a resource overload (if any)? Discuss in detail the implications thereof as well as you approach regarding implementation.
- g. The client has informed you that the project duration is 18 working days, discuss in detail the implications thereof as well as you approach regarding implementation.
- h. The client has informed you that the project duration is 14 working days, discuss in detail the implications thereof as well as you approach regarding implementation.
The project starts on Monday 16 November 2020. Work days are five (5) days a week from Monday to Friday. Saturdays and Sundays are non-working days. Public holidays are working days.
Detail of the activities are given below:
| Predecessors | Activity Number | Duration (work days) |
| - | A | 4 |
| A, C | B | 2 |
| B | C | 3 |
| C, F | D | 2 |
| A | E | 3 |
| E | F | 1 |
| D | G | 5 |
Some of these activities cannot be started until others have been completed:
- A is a start activity
- B and E must follow A
- C must follow B
- F must follow E
- D must follow C and F
- G must follow D
I have tried GRAPH PERT GENERATOR and i am getting the following results:
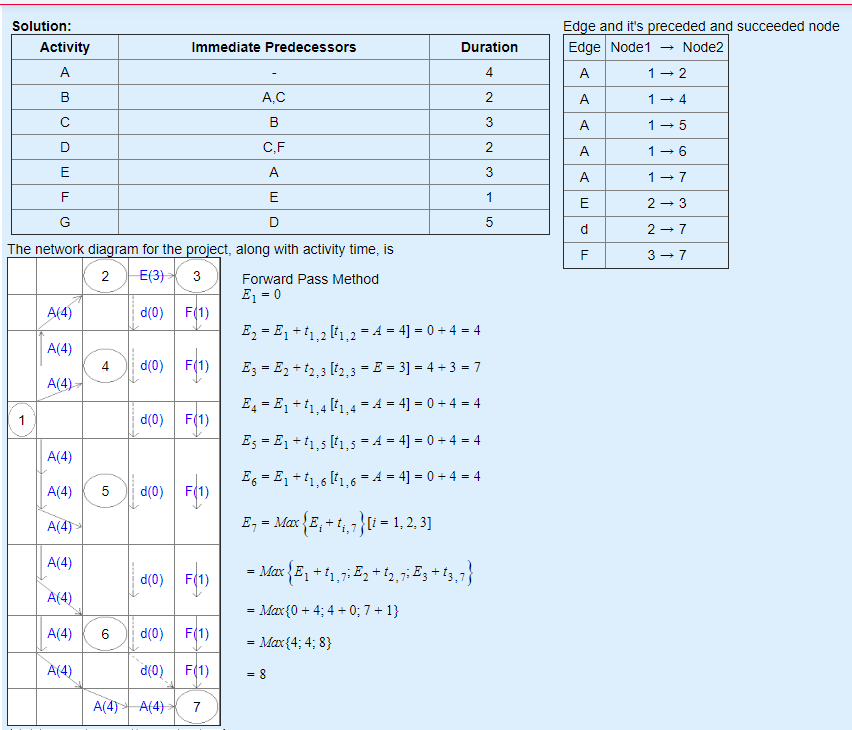
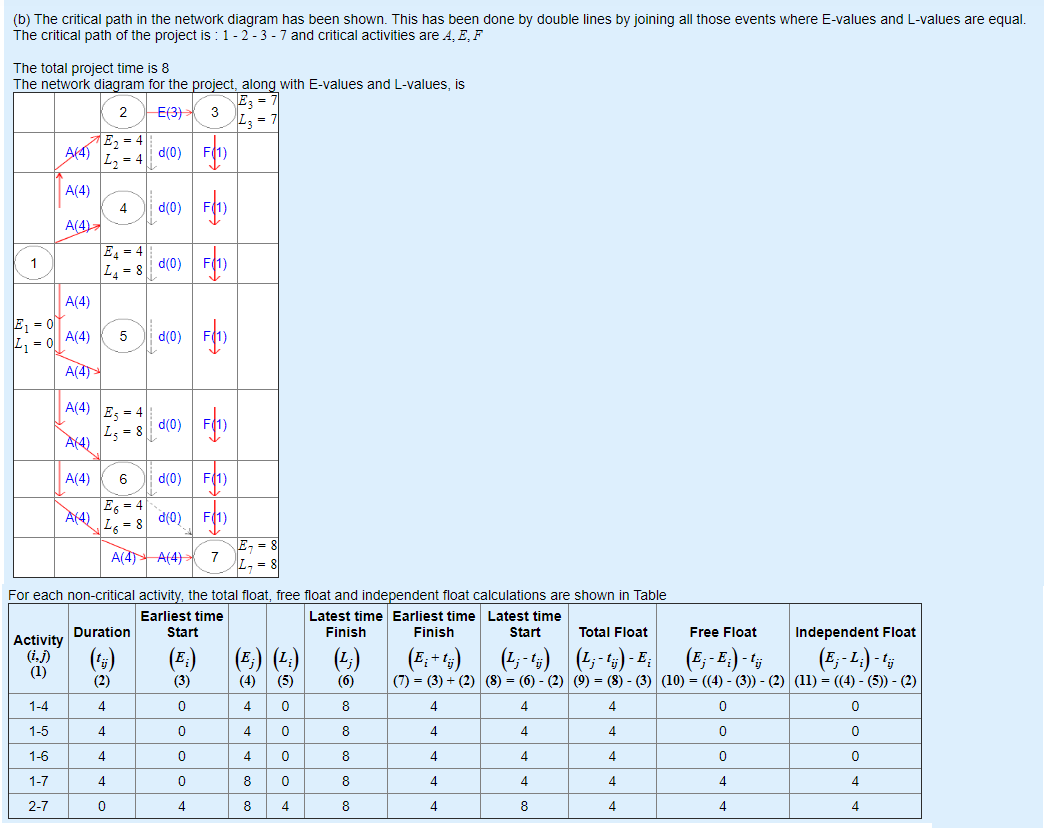
Solution: Activity Immediate Predecessors Duration Edge and it's preceded and succeeded node Edge Node 1 Node2 A 1 2 1-4 4 B A.C 2 A 3 1 5 B C.F. D N A 16 E A 3 1 - 7 F E 1 E 2 3 G D Lo d 27 TI 3-7 2 dro) F10 The network diagram for the project, along with activity time, is 2 E(3) 3 Forward Pass Method Ej = 0 A(4) d(0) F(1) E2 = E+11,2 (1,2 = A = 4] = 0) + 4 = 4 A(4) Ez = E2 + 12,3 [12,3 = E = 3) = 4 + 3 = 7 A(4) E4 = E, +11,461,4 = A = 4) = 0 + 4 = 4 F(1) Es = E7 + 11,5 (1,5 = A = 4) = 0) + 4 = 4 A(4) E. - E+11,6 (11,6 = 4 = 4] = 0) + 4 = 4 A(4) 5 A(4) E, = Max {E:+43,7}{i= 1, 2, 3] 1 dlo) F1 A(4) (O) FLV = Max {E; +11,7;E2 + 12,7; Ez + 13,7) A(4) = Max{0 + 4; 4 +0:7 +1} A(4) 6 d(0) F(1) = Max{4; 4; 8) A(4) d(0) F11) = 8 A(4) A(4) 7 (b) The critical path in the network diagram has been shown. This has been done by double lines by joining all those events where E-values and L-values are equal. The critical path of the project is : 1-2-3- 7 and critical activities are A, E, F The total project time is 8 The network diagram for the project, along with E-values and L-values, is 2 E(3) 3 A(4) E = 4 L = 4 d(0) F1 A(4) 4 A(4) dlo Fly dlo Fly 1 E. = 4 2=8 A(4) E-01 L1 = A(4) on 5 dlo Fly A(4) A(4) Es = 4 d(0) 2g = 8 Flag A(4) 6 d(0) F11) En = 4 16=8 do FP A( 4A(4) For each non-critical activity, the total float, free float and independent float calculations are shown in Table Earliest time Latest time Earliest time Latest time Duration Start Finish Finish Start Total Float Free Float Independent Float Activity (1,7) (1; -1 E; (E;-E;) (1) (2) (3) (4) (5) (6) (7) = (3) + (2) (8) = (6)-(2) (9) = (8) - (3) (10) = ((4) - (3)) - (2) (11) = ((4) - (5)) - (2) 1-4 4 0 0 8 4 4 4 0 0 (1;) (E;-1;) - 4 1-5 4 0 4 0 8 4 4 4 0 0 4 0 4 0 8 o 4 4 4 0 1-6 1-7 4 0 8 0 8 4 4 4 4 4 2-7 0 4 8 4 8 4 8 4 4 4
Step by Step Solution
There are 3 Steps involved in it
1 Expert Approved Answer
Step: 1 Unlock

Question Has Been Solved by an Expert!
Get step-by-step solutions from verified subject matter experts
Step: 2 Unlock
Step: 3 Unlock