

Question: 1 Draw a bar graph that visually represents the data Effect of Human Generated Carbon Emissions on the Cryosphere Atmosphere and Geosphere A Air Temperature

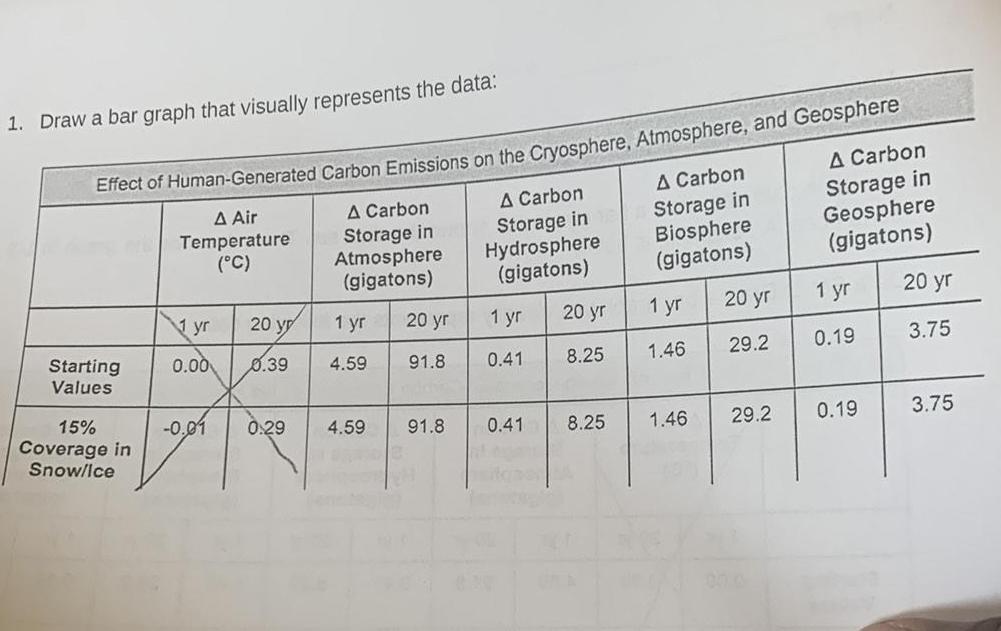
1 Draw a bar graph that visually represents the data Effect of Human Generated Carbon Emissions on the Cryosphere Atmosphere and Geosphere A Air Temperature C Starting Values 15 Coverage in Snow ice yr 20 y 0 00 0 39 0 01 A Carbon Storage in Atmosphere gigatons 1 yr 4 59 20 yr 91 8 0 29 4 59 91 8 A Carbon Storage in Hydrosphere gigatons 1 yr 0 41 0 41 20 yr 8 25 8 25 A Carbon Storage in Biosphere gigatons 1 yr 1 46 1 46 20 yr 29 2 A Carbon Storage in Geosphere gigatons 29 2 1 yr 0 19 0 19 20 yr 3 75 3 75
Step by Step Solution
There are 3 Steps involved in it
1 Expert Approved Answer
Step: 1 Unlock

Question Has Been Solved by an Expert!
Get step-by-step solutions from verified subject matter experts
Step: 2 Unlock
Step: 3 Unlock