

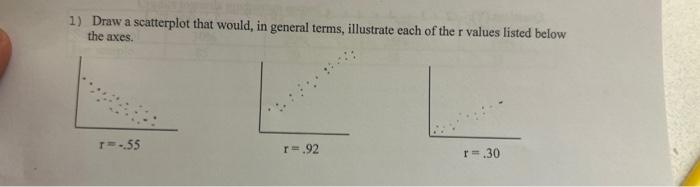
Question: 1) Draw a scatterplot that would, in general terms, illustrate each of the r values listed below the axes. T-.55 r=.92 r=.30
1) Draw a scatterplot that would, in general terms, illustrate each of the r values listed below the axes. T-.55 r=.92 r=.30
Step by Step Solution
There are 3 Steps involved in it
1 Expert Approved Answer
Step: 1 Unlock

Question Has Been Solved by an Expert!
Get step-by-step solutions from verified subject matter experts
Step: 2 Unlock
Step: 3 Unlock