

Question: 1. Draw an activity on node network Diagram 2. 3. Calculate the probability that the project will be completed in less than 28 weeks. (Appendix
1. Draw an activity on node network Diagram
2.
3.
Calculate the probability that the project will be completed in less than 28 weeks. (Appendix B, Table B.2, is found on page 868 of your textbook-- and is also found inside the back cover of your text.)
P (project: 28 weeks) = ____________
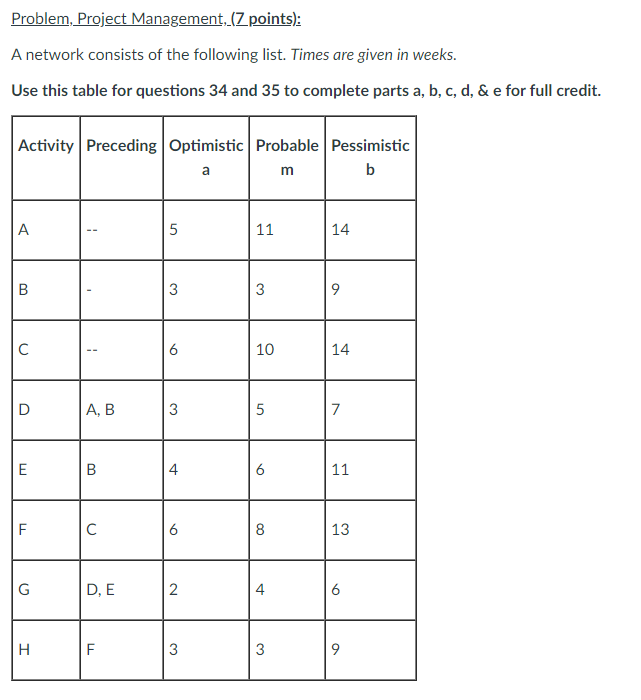
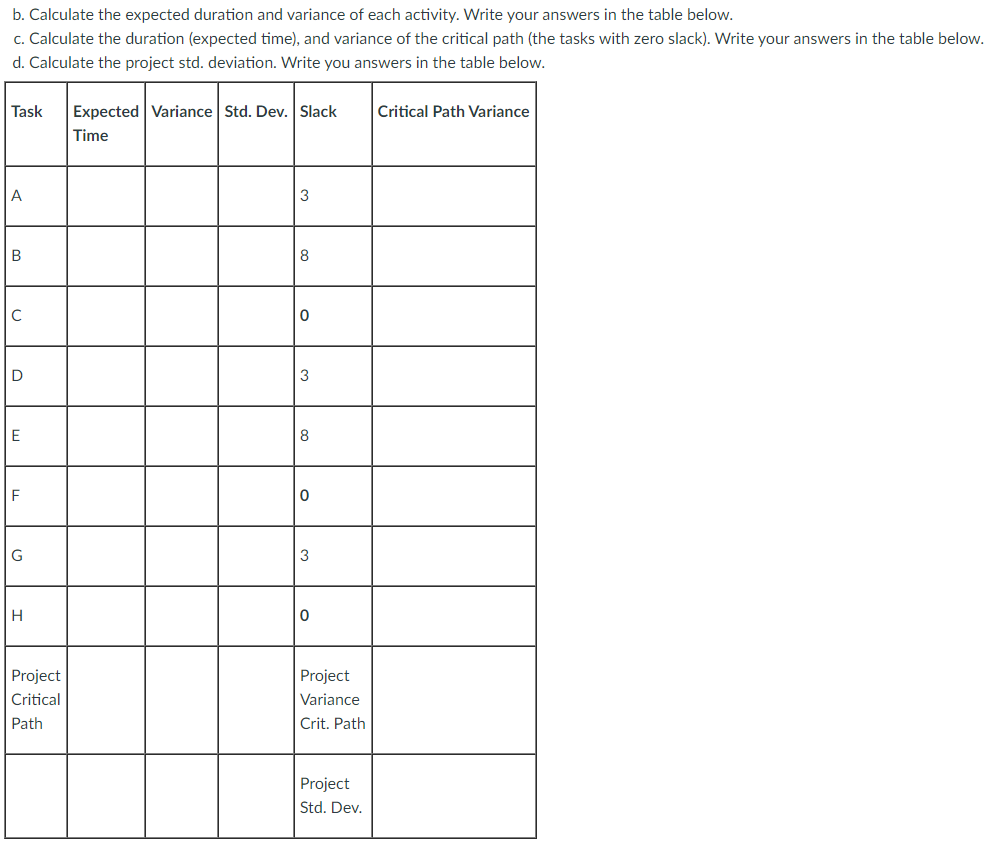
Problem, Project Management,_(Zpoints): A network consists of the following list. Times are given in weeks. Use this table for questions 34 and 35 to complete parts a, b, c, d, \& e for full credit. b. Calculate the expected duration and variance of each activity. Write your answers in the table below. c. Calculate the duration (expected time), and variance of the critical path (the tasks with zero slack). Write your answers in the table below. d. Calculate the nroiert std. deviation. Write vou answers in the table helowStep by Step Solution
There are 3 Steps involved in it
1 Expert Approved Answer
Step: 1 Unlock

Question Has Been Solved by an Expert!
Get step-by-step solutions from verified subject matter experts
Step: 2 Unlock
Step: 3 Unlock