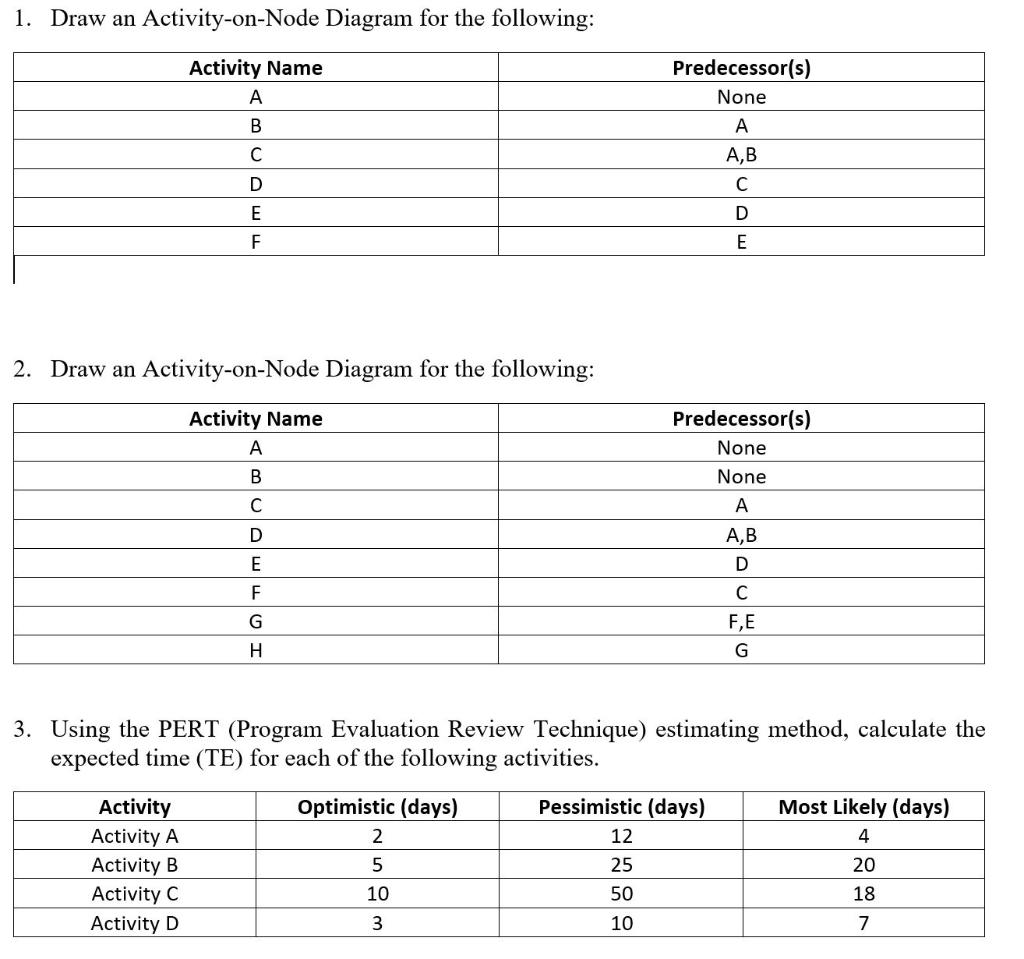
Question: 1. Draw an Activity-on-Node Diagram for the following: Activity Name A B Predecessor(s) None A,B C D D E F E 2. Draw an Activity-on-Node

1. Draw an Activity-on-Node Diagram for the1. Draw an Activity-on-Node Diagram for the

1. Draw an Activity-on-Node Diagram for the following: Activity Name A B Predecessor(s) None A,B C D D E F E 2. Draw an Activity-on-Node Diagram for the following: Activity Name A B | Predecessor(s) None None A A,B D FE G 3. Using the PERT (Program Evaluation Review Technique) estimating method, calculate the expected time (TE) for each of the following activities. Most Likely (days) 4 Activity Activity A Activity B Activity C Activity D Optimistic (days) 2 5 10 Pessimistic (days) 12 25 50 20 18 3 10 7 4. Draw an Activity-on-Node Diagram, identify project duration and project critical path for the following: Activity Name . Predecessor(s) None None Duration (Weeks) 20 B 10 10 D 40 A,B D E 10 20 F E 5. Draw an Activity-on-Arrow Diagram, identify project duration, slack for each activity, and project critical path for the following: Activity Name A B Duration (Weeks) 20 10 10 Predecessor(s) None None None A,B C C,D E,F D 40 E 10 F 20 G 10 6. Draw an Activity-on-Node Diagram, identify activity duration, slack for each activity, project duration, and project critical path for the following: a b Activity Name Predecessor(s) None None None m 50 30 20 20 10 10 B 90 40 30 C D A 30 E 20 10 20 10 B,C C,D F 10 20 30 30 60 F G 20 50

Step by Step Solution

There are 3 Steps involved in it

1 Expert Approved Answer
Step: 1 Unlock blur-text-image
Question Has Been Solved by an Expert!

Get step-by-step solutions from verified subject matter experts

Step: 2 Unlock
Step: 3 Unlock

Students Have Also Explored These Related General Management Questions!