

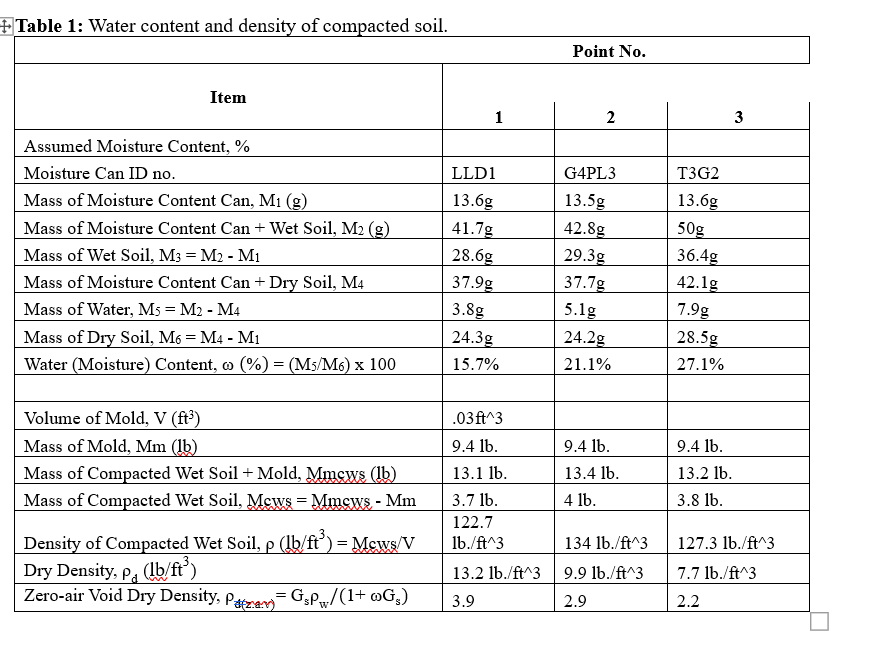
Question: 1 ) Draw the compaction curve ( i . e . , plot the dry density values on the y - axis and the moisture
Draw the compaction curve ie plot the dry density values on the yaxis and the moisture contents on the xaxis Draw a smooth curve connecting the plotted points. Plot the zeroairvoid line on the same graph.
Note: This Graph should look like the Compaction Curve on slide of Lecture soils slides.
Identify and report the optimum moisture content OMC or omega "opt" and the maximum dry density MDD or rho dmax The optimum moisture content OMC or omega "opt" is the water content that results in the greatest dry density for a specified compactive effort.
Step by Step Solution
There are 3 Steps involved in it
1 Expert Approved Answer
Step: 1 Unlock

Question Has Been Solved by an Expert!
Get step-by-step solutions from verified subject matter experts
Step: 2 Unlock
Step: 3 Unlock