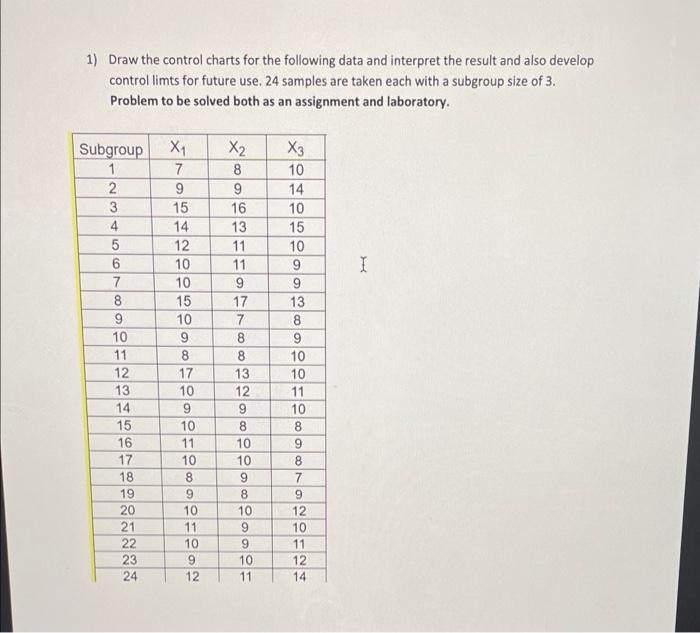
Question: 1) Draw the control charts for the following data and interpret the result and also develop control limts for future use. 24 samples are taken

1) Draw the control charts for the following data
1) Draw the control charts for the following data and interpret the result and also develop control limts for future use. 24 samples are taken each with a subgroup size of 3. Problem to be solved both as an assignment and laboratory. Subgroup X X X3 1 7 8 10 2 9 9 14 3 15 16 10 4 14 13 15 5 12 11 10 6 10 11 9 7 10 9 9 15 17 13 10 7 8 9 8 9 8 8 10 17 13 10 10 12 11 9 9 10 10 8 8 11 10 10 10 8 8 9 9 8 9 10 10 12 11 9 10 10 11 9 12 12 14 8 9 10 11 12 13 14 15 16 17 18 19. 20 21 22 23 24 9 10 11

Step by Step Solution

There are 3 Steps involved in it

1 Expert Approved Answer
Step: 1 Unlock blur-text-image
Question Has Been Solved by an Expert!

Get step-by-step solutions from verified subject matter experts

Step: 2 Unlock
Step: 3 Unlock

Students Have Also Explored These Related General Management Questions!