

Question: coment also please 1) Draw the control charts for the following data and interpret the result and also develop control limts for future use. 24
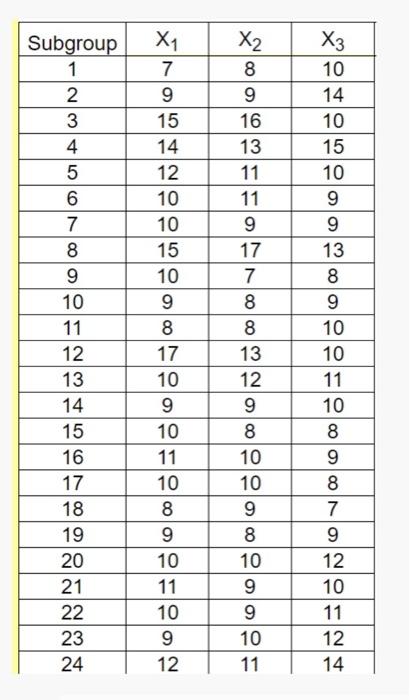
1) Draw the control charts for the following data and interpret the result and also develop control limts for future use. 24 samples are taken each with a subgroup size of 3 . Use the standard excel template and analyze. \begin{tabular}{|c|c|c|c|} \hline Subgroup & X1 & X2 & X3 \\ \hline 1 & 7 & 8 & 10 \\ \hline 2 & 9 & 9 & 14 \\ \hline 3 & 15 & 16 & 10 \\ \hline 4 & 14 & 13 & 15 \\ \hline 5 & 12 & 11 & 10 \\ \hline 6 & 10 & 11 & 9 \\ \hline 7 & 10 & 9 & 9 \\ \hline 8 & 15 & 17 & 13 \\ \hline 9 & 10 & 7 & 8 \\ \hline 10 & 9 & 8 & 9 \\ \hline 11 & 8 & 8 & 10 \\ \hline 12 & 17 & 13 & 10 \\ \hline 13 & 10 & 12 & 11 \\ \hline 14 & 9 & 9 & 10 \\ \hline 15 & 10 & 8 & 8 \\ \hline 16 & 11 & 10 & 9 \\ \hline 17 & 10 & 10 & 8 \\ \hline 18 & 8 & 9 & 7 \\ \hline 19 & 9 & 8 & 9 \\ \hline 20 & 10 & 10 & 12 \\ \hline 21 & 11 & 9 & 10 \\ \hline 22 & 10 & 9 & 11 \\ \hline 23 & 9 & 10 & 12 \\ \hline 24 & 12 & 11 & 14 \\ \hline \end{tabular} Problem 1 ( 40) marks Rubrics Original Set data with control charts shown for Mean and Range with comments (15) each Graph 7.5 Revised data eliminating the outliers shown for Mean and Range with comments(15) each Graph 7.5 Final Stabilized graph with comments (5+5)
Step by Step Solution
There are 3 Steps involved in it

Get step-by-step solutions from verified subject matter experts