

Question: 1. Drop Down Options are Less/Greater 2. Drop Down Options are Shortage/Surplus The following graph depicts the supply schedule for euros (orange line) and the
1. Drop Down Options are Less/Greater
2. Drop Down Options are Shortage/Surplus
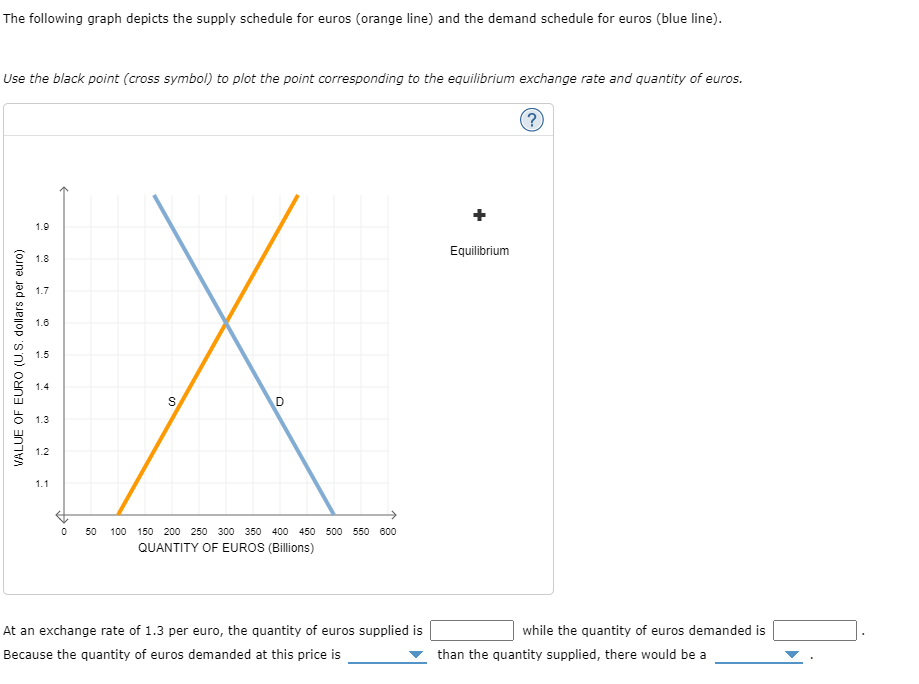
The following graph depicts the supply schedule for euros (orange line) and the demand schedule for euros (blue line). Use the black point (cross symbol) to plot the point corresponding to the equilibrium exchange rate and quantity of euros. 1.9 Equilibrium 1.8 1.7 1.6 VALUE OF EURO (U.S. dollars per euro) 1.5 1.4 S D 1.3 1.2 1.1 0 50 100 150 200 250 300 350 400 450 500 550 600 QUANTITY OF EUROS (Billions) At an exchange rate of 1.3 per euro, the quantity of euros supplied is Because the quantity of euros demanded at this price is while the quantity of euros demanded is than the quantity supplied, there would be a
Step by Step Solution
There are 3 Steps involved in it

Get step-by-step solutions from verified subject matter experts