

Question: 1. Enter data file in to SPSS: - Go to variable view and enter variables then go to data view and enter the data.
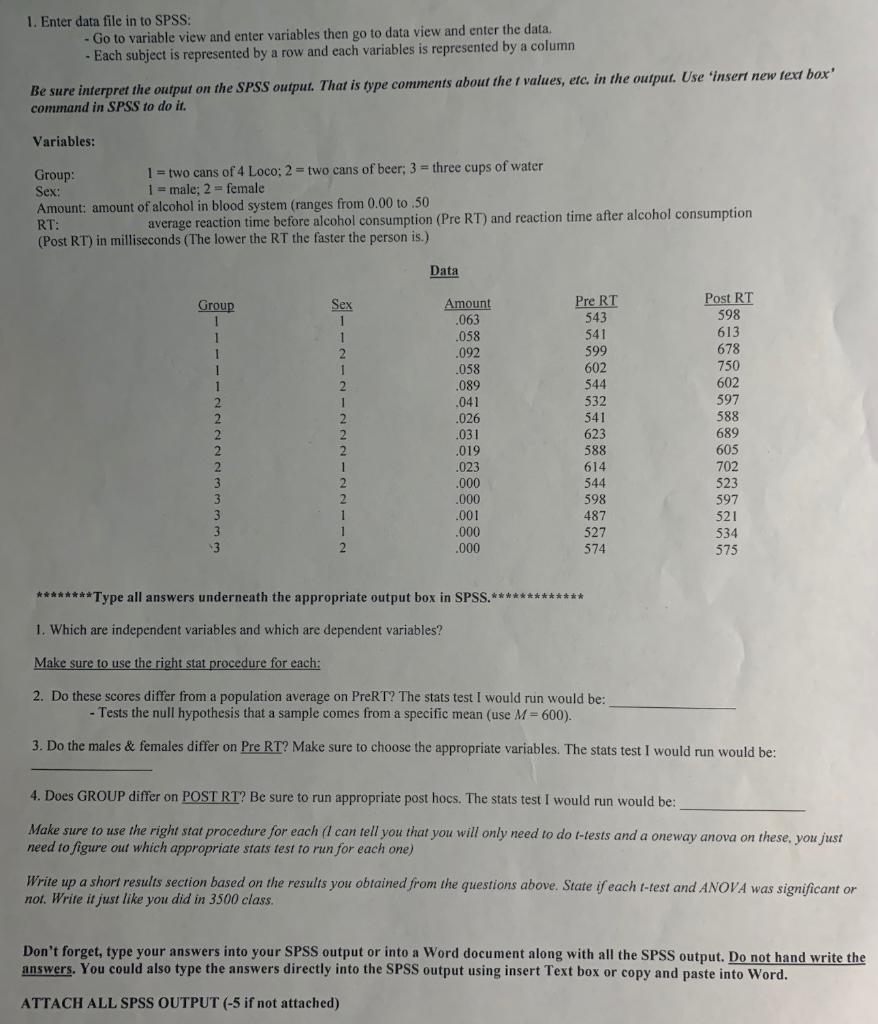
1. Enter data file in to SPSS: - Go to variable view and enter variables then go to data view and enter the data. - Each subject is represented by a row and each variables is represented by a column Be sure interpret the output on the SPSS output. That is type comments about the t values, etc. in the output. Use 'insert new text box' command in SPSS to do it. Variables: 1 = two cans of 4 Loco; 2= two cans of beer; 3= three cups of water 1= male; 2= female Group: Sex: Amount: amount of alcohol in blood system (ranges from 0.00 to .50 RT: average reaction time before alcohol consumption (Pre RT) and reaction time after alcohol consumption (Post RT) in milliseconds (The lower the RT the faster the person is.) Group 1 Sex 1 1 Data Amount .063 .058 .092 .058 .089 .041 .026 .031 .019 023 .000 .000 .001 .000 .000 Pre RT 543 541 599 602 544 532 541 623 588 614 544 598 487 527 574 Post RT 598 613 678 750 602 597 588 689 605 702 523 597 521 534 575 ******** Type all answers underneath the appropriate output box in SPSS.************* 1. Which are independent variables and which are dependent variables? Make sure to use the right stat procedure for each: 2. Do these scores differ from a population average on PreRT? The stats test I would run would be: - Tests the null hypothesis that a sample comes from a specific mean (use M = 600). 3. Do the males & females differ on Pre RT? Make sure to choose the appropriate variables. The stats test I would run would be: 4. Does GROUP differ on POST RT? Be sure to run appropriate post hocs. The stats test I would run would be: Make sure to use the right stat procedure for each (I can tell you that you will only need to do t-tests and a oneway anova on these, you just need to figure out which appropriate stats test to run for each one) Write up a short results section based on the results you obtained from the questions above. State if each t-test and ANOVA was significant or not. Write it just like you did in 3500 class. Don't forget, type your answers into your SPSS output or into a Word document along with all the SPSS output. Do not hand write the answers. You could also type the answers directly into the SPSS output using insert Text box or copy and paste into Word. ATTACH ALL SPSS OUTPUT (-5 if not attached)
Step by Step Solution
3.48 Rating (161 Votes )
There are 3 Steps involved in it
1 Independent Variables Group Sex Dependent Variables Amount Pre RT Post RT 2 The stats ... View full answer

Get step-by-step solutions from verified subject matter experts