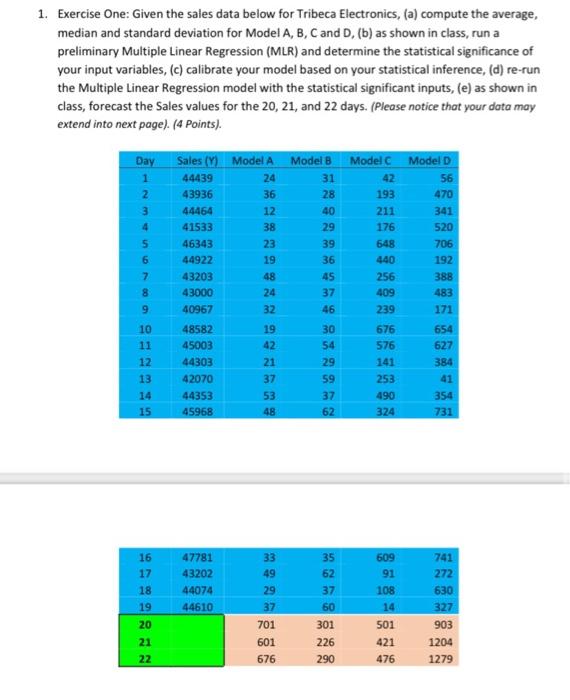
Question: 1. Exercise One: Given the sales data below for Tribeca Electronics, (a) compute the average, median and standard deviation for Model A, B, C and

1. Exercise One: Given the sales data below for
1. Exercise One: Given the sales data below for Tribeca Electronics, (a) compute the average, median and standard deviation for Model A, B, C and D. (b) as shown in class, run a preliminary Multiple Linear Regression (MLR) and determine the statistical significance of your input variables, (c) calibrate your model based on your statistical inference, (d) re-run the Multiple Linear Regression model with the statistical significant inputs, (e) as shown in class, forecast the Sales values for the 20, 21, and 22 days. (Please notice that your data may extend into next page). (4 Points). Day 1 2 3 4 5 6 7 Sales (Y) Model A Model B Model Model D 44439 24 31 42 56 43936 36 28 193 470 44464 12 40 211 341 41533 38 29 176 520 46343 23 39 648 706 44922 19 36 440 192 43203 48 45 256 388 43000 24 37 409 483 40967 32 46 239 171 48582 19 30 676 654 45003 42 54 576 627 44303 21 141 384 42070 37 59 253 41 44353 53 37 490 354 45968 48 62 324 731 8 9 10 11 12 13 14 29 15 16 17 18 19 20 21 22 47781 43202 44074 44610 33 49 29 37 701 601 676 35 62 37 60 301 226 290 609 91 108 14 501 421 476 741 272 630 327 903 1204 1279

Step by Step Solution

There are 3 Steps involved in it

1 Expert Approved Answer
Step: 1 Unlock blur-text-image
Question Has Been Solved by an Expert!

Get step-by-step solutions from verified subject matter experts

Step: 2 Unlock
Step: 3 Unlock

Students Have Also Explored These Related General Management Questions!