

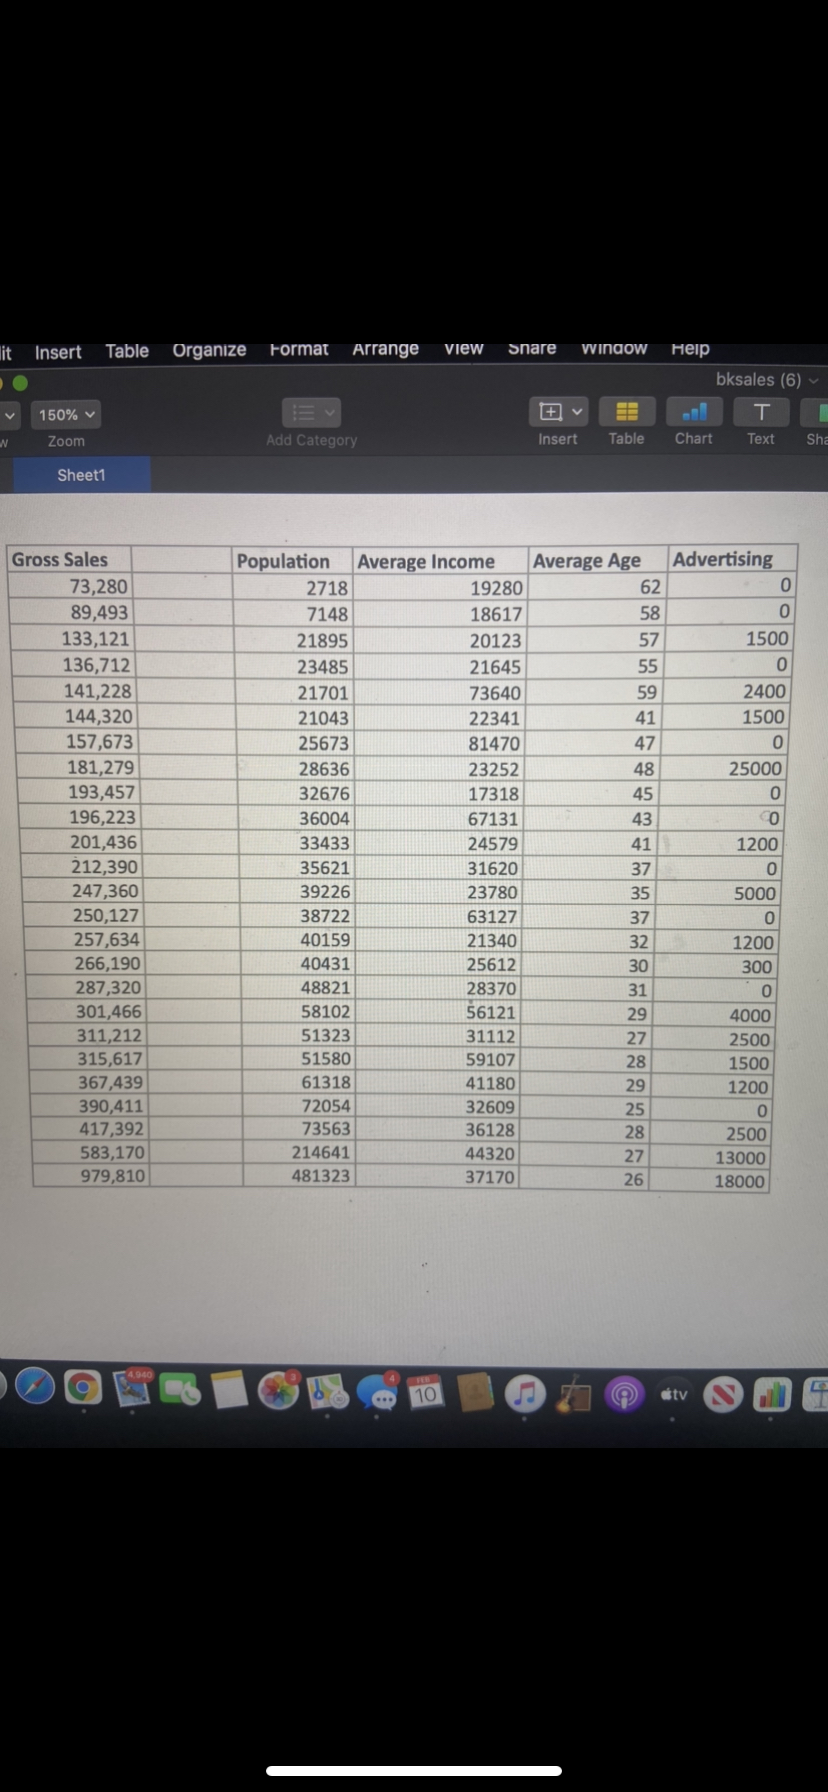
Question: 1. First, use the Gross Sales variable to calculate the mean, standard deviation, and 5-number summary. Comment on the shape of the distribution (no need
1. First, use the Gross Sales variable to calculate the mean, standard deviation, and 5-number summary. Comment on the shape of the distribution (no need to include a graph)
2. Next, examine the data in each of the columns for Population (the local population of the area), Average Income (average annual income of the area), Average Age (average age in the area), and Advertising (dollars spent on advertising in the previous month). Compute the mean and standard deviation for each variable.
3. Thinking qualitatively - is there any variable given that is likely to be a better explanatory variable for our response variable of Gross Sales than the other? Why or why not?
4. Using Population as the explanatory variable on the x-axis, and Gross Sales as the response variable on the y-axis. Comment on the shape of the scatterplot. Does the data show a strong or weak association? Is it a linear or nonlinear shape? Are there any outliers or influential points?
5. Run a Linear Regression with Gross Sales as your left-hand y-variable and Population as the x-variable on the right hand side. Give the equation, the correlation coefficient, and the R- squared value. Does this appear to be a useful regression equation?
6. Repeat steps 4 and 5, drawing a scatterplot, commenting on its appearance, running a linear regression and recording and commenting on the results, this time using Average Income as the explanatory variable, with Gross Sales as the response variable.
7. Repeat steps 4 and 5, drawing a scatterplot, commenting on its appearance, running a linear regression and recording and commenting on the results, this time using Average Age as the explanatory variable, with Gross Sales as the response variable.
8. Repeat steps 4 and 5, drawing a scatterplot, commenting on its appearance, running a linear regression and recording and commenting on the results, this time using Advertising as the explanatory variable, with Gross Sales as the response variable.
Step by Step Solution
There are 3 Steps involved in it

Get step-by-step solutions from verified subject matter experts