Question: 1: For each data table below, determine the best type of model to fit the data. Then, using your calculator or bj hand, find an
1:
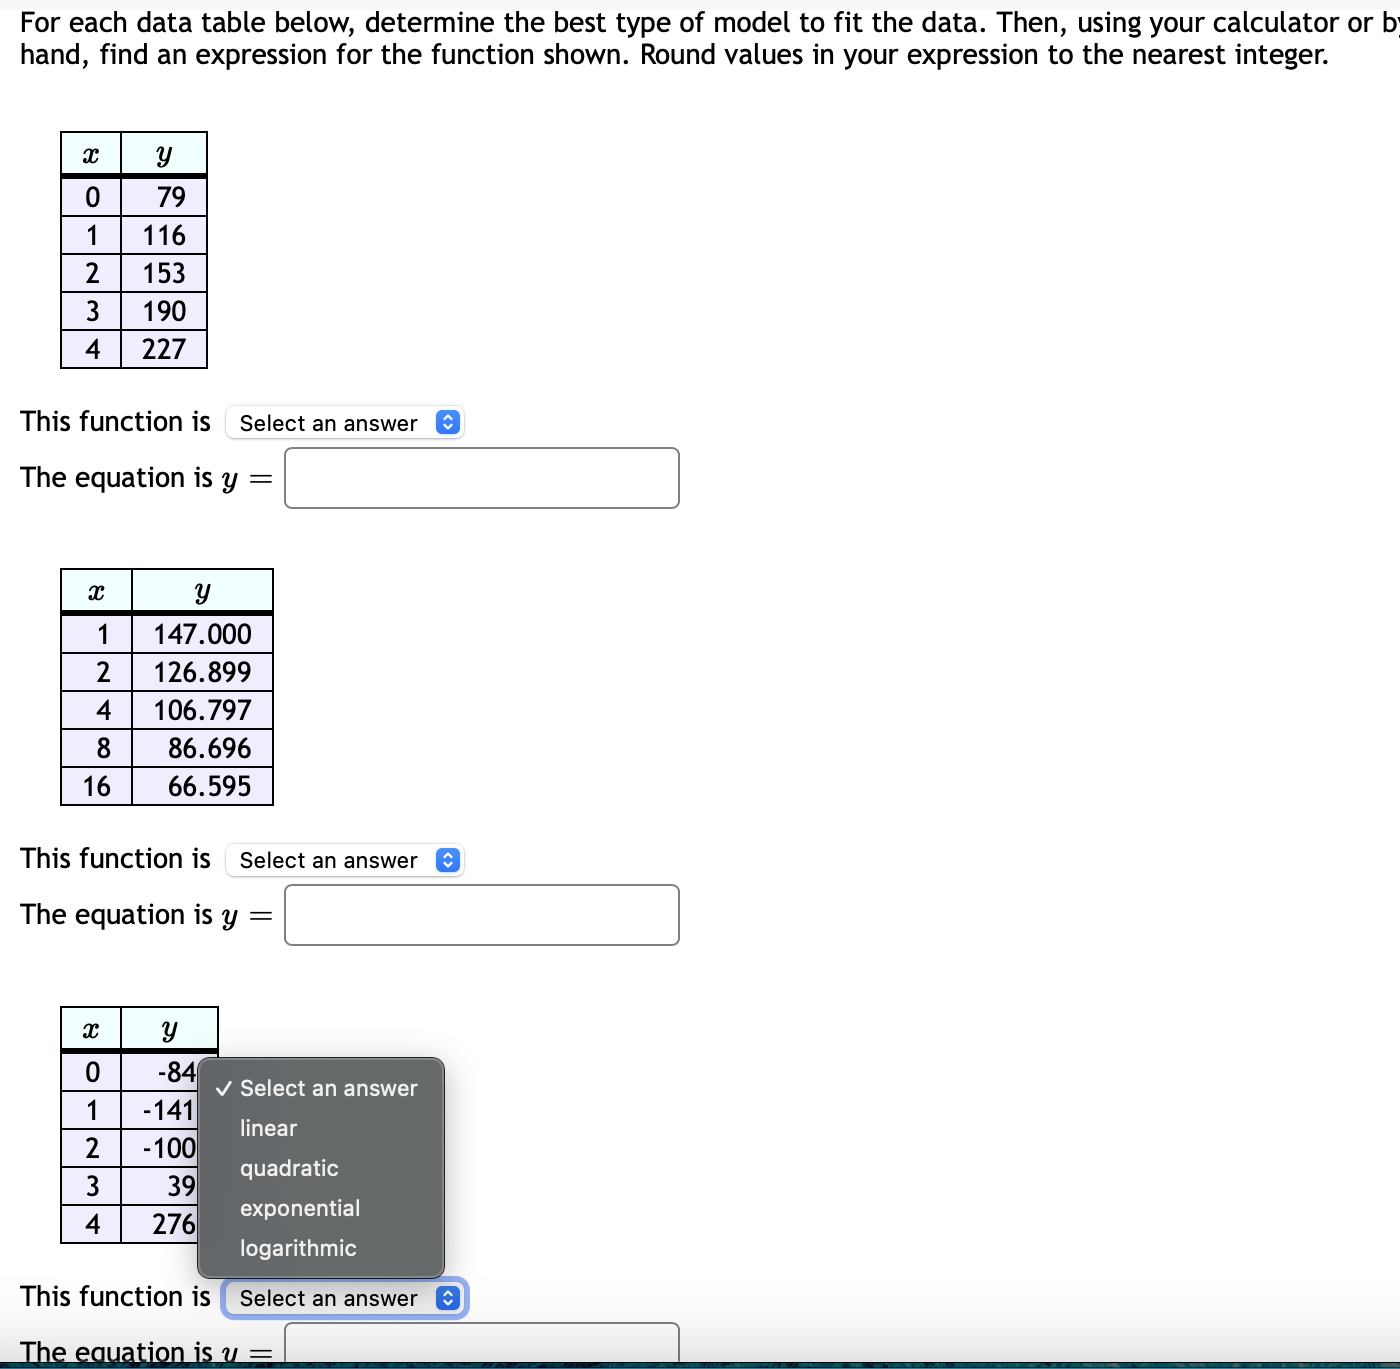
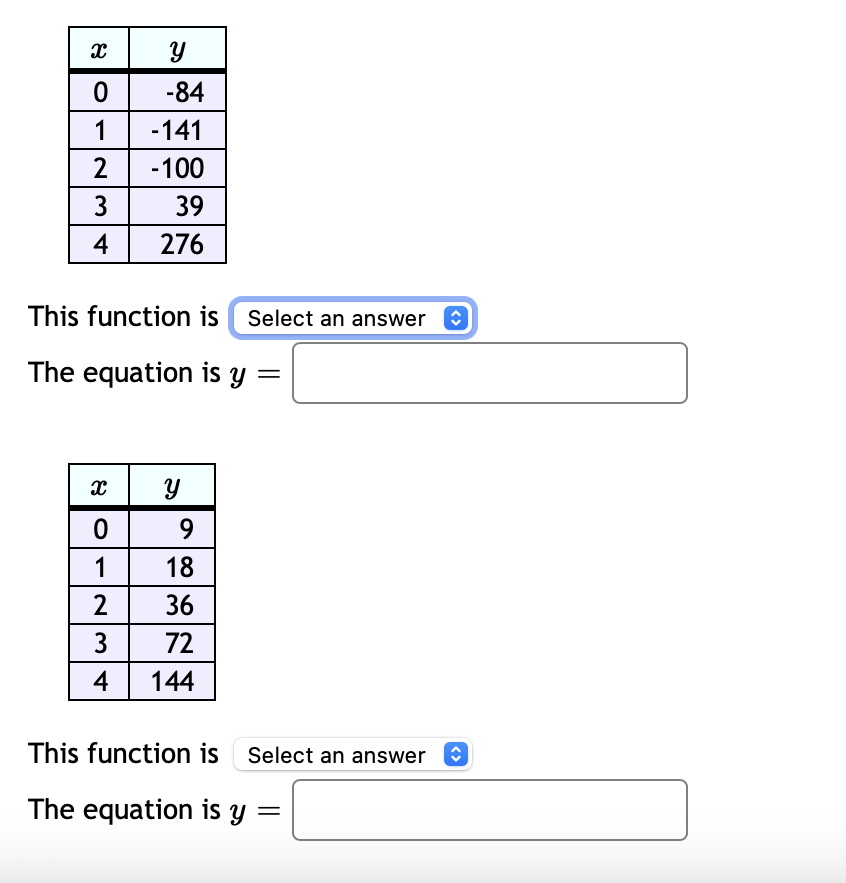
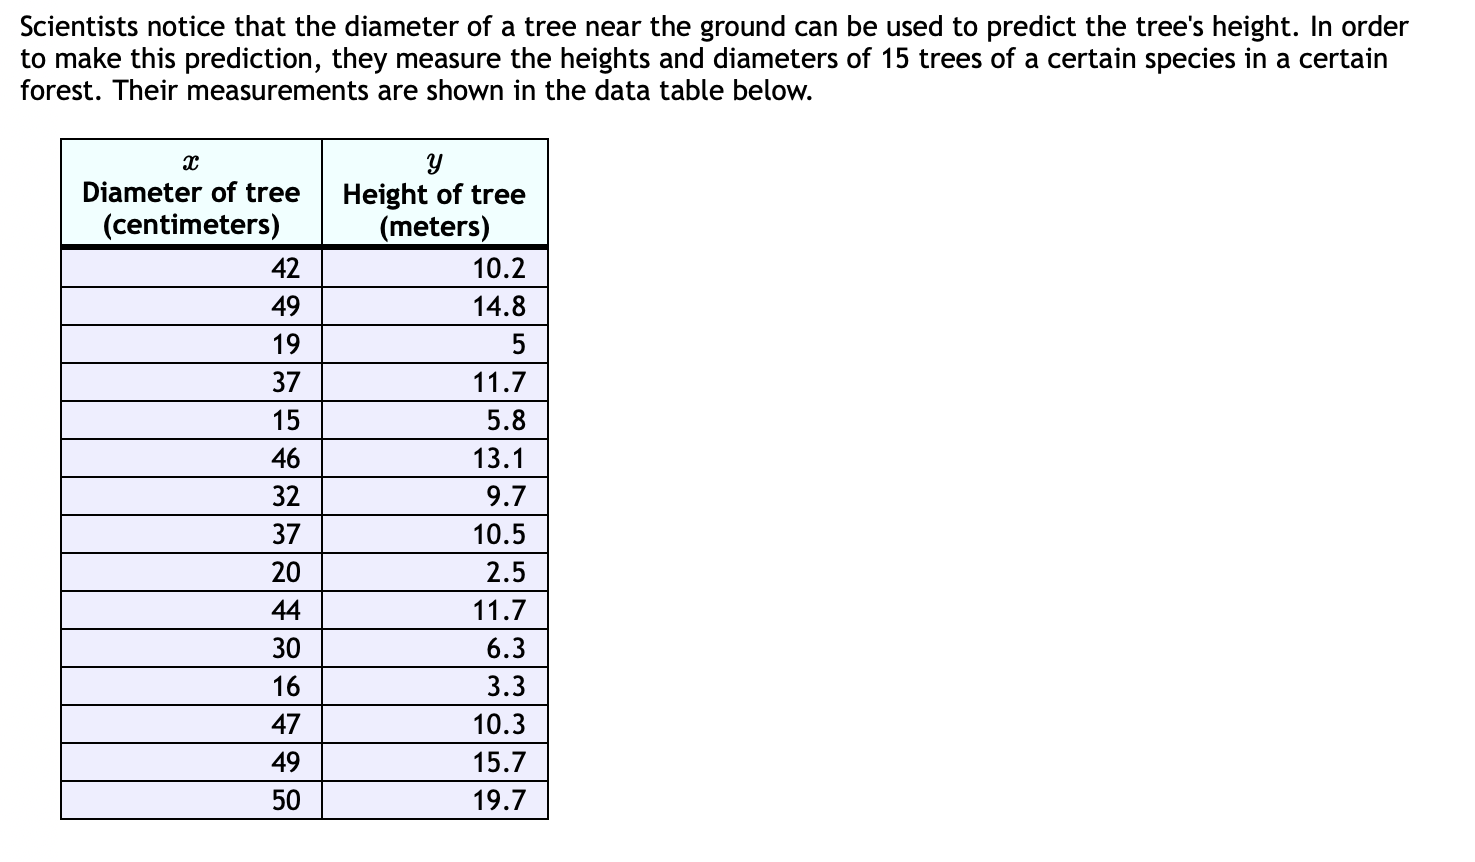
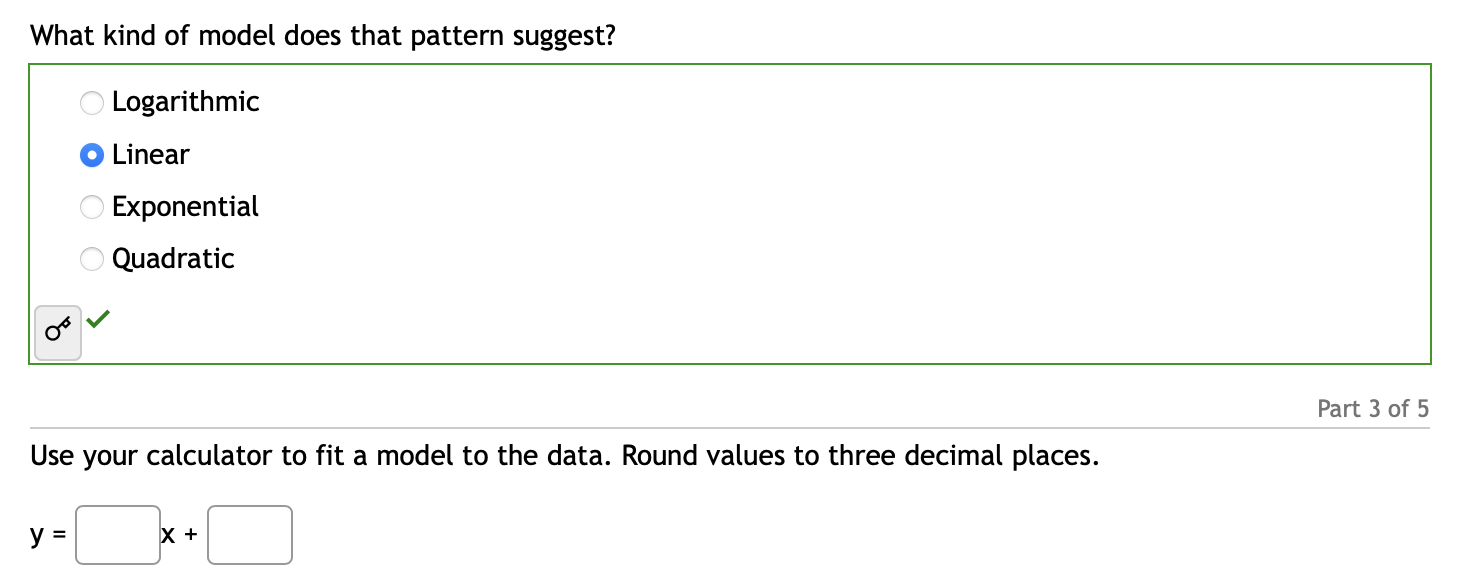
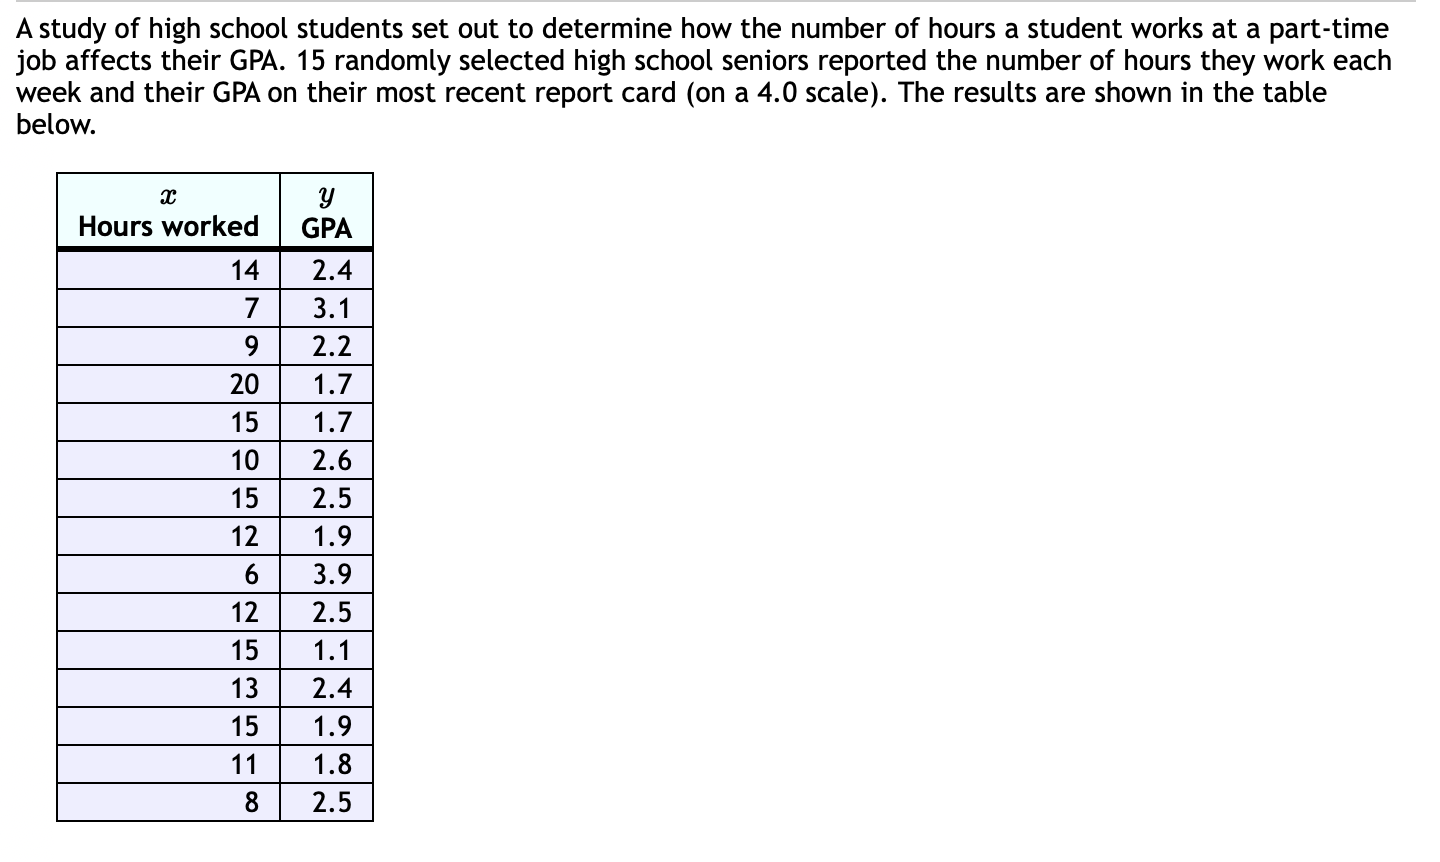
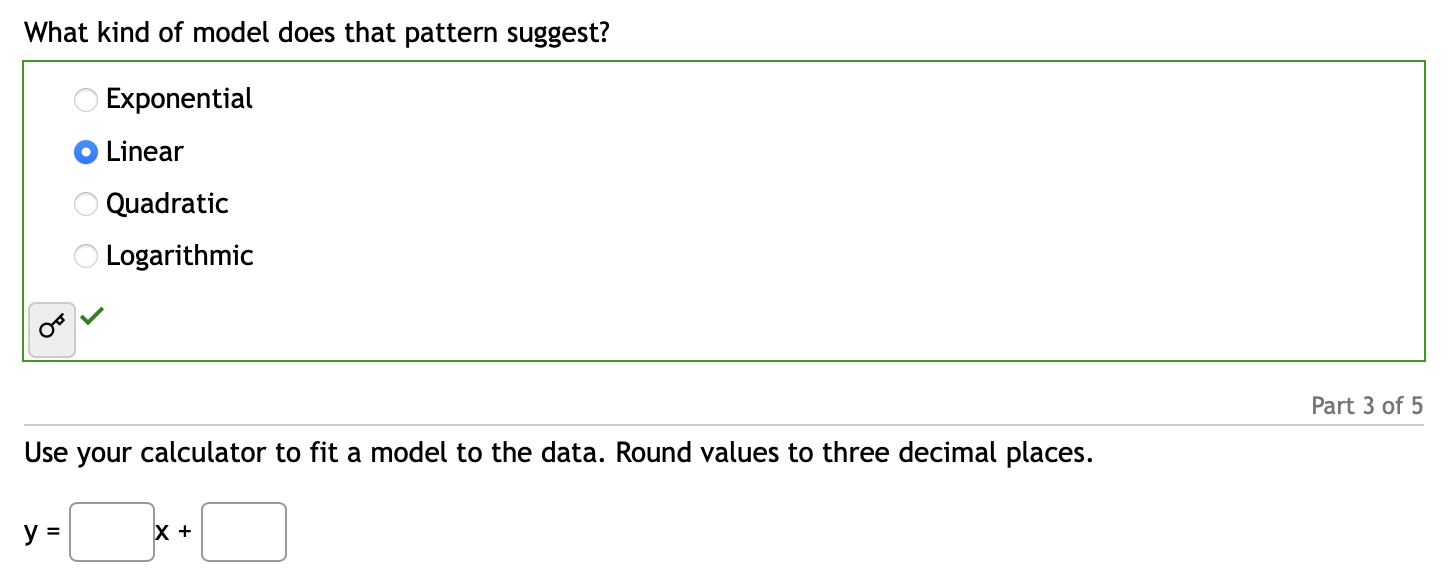
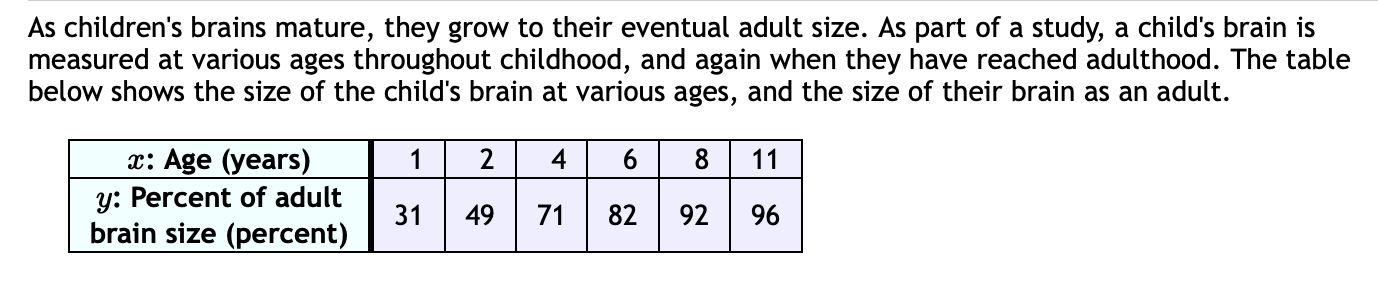
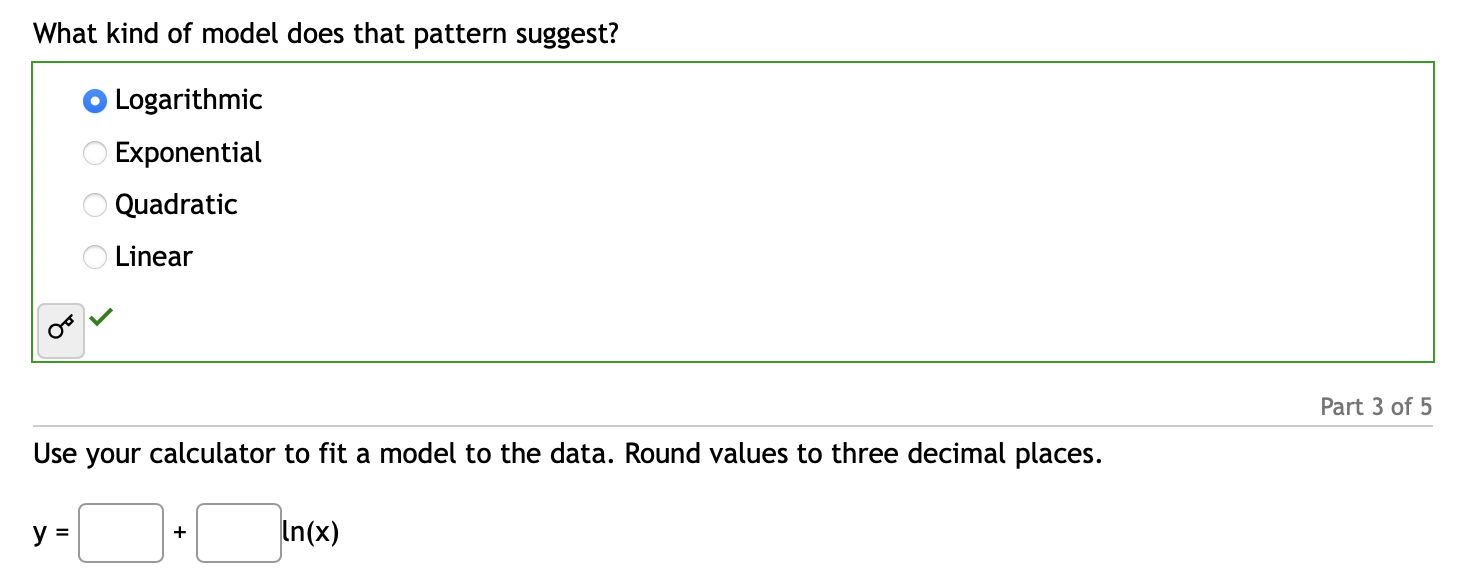
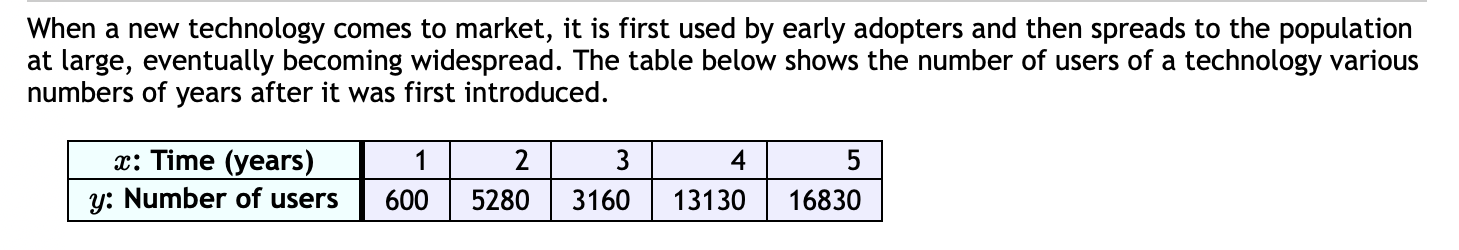
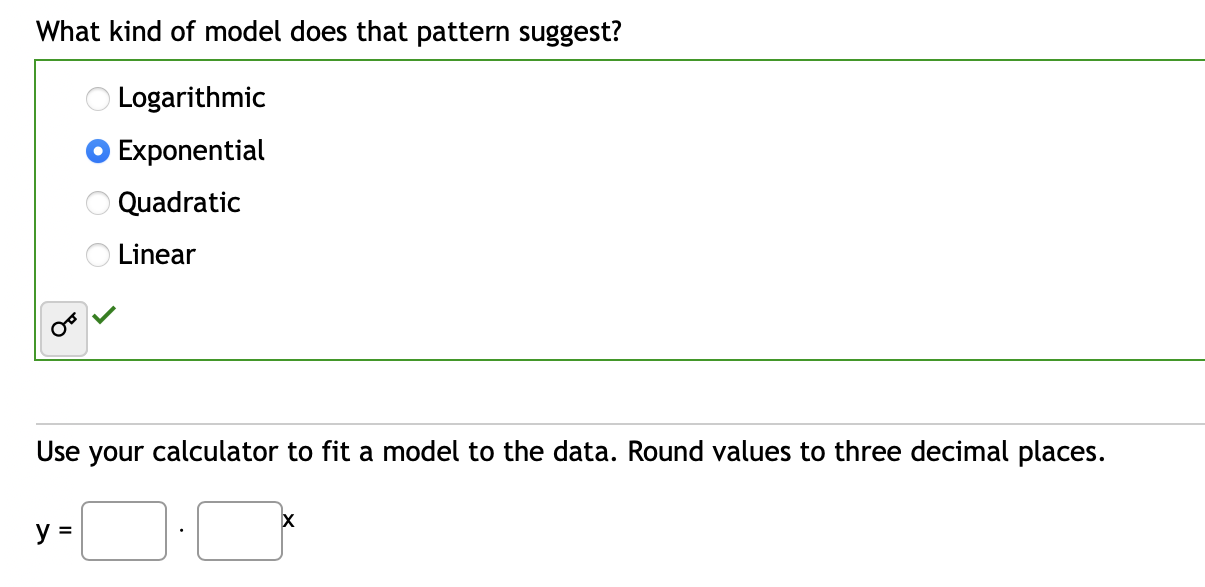
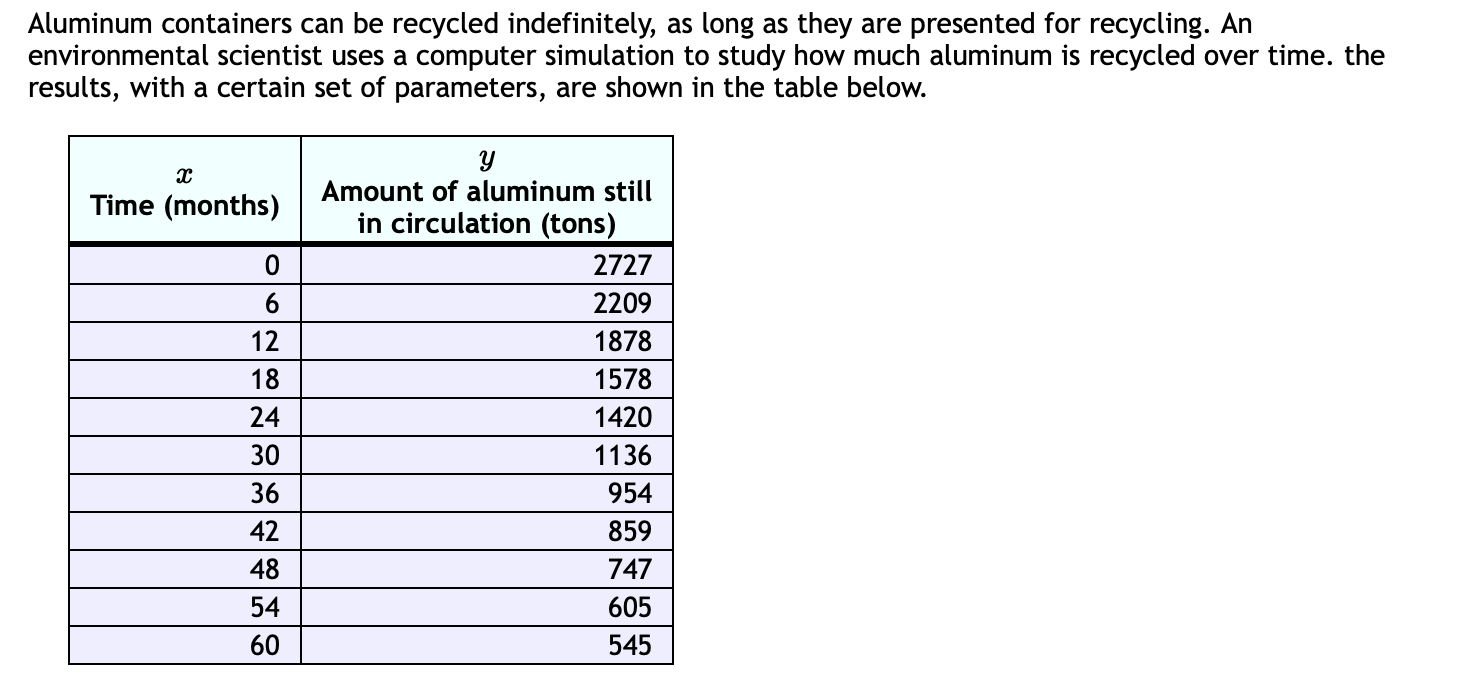
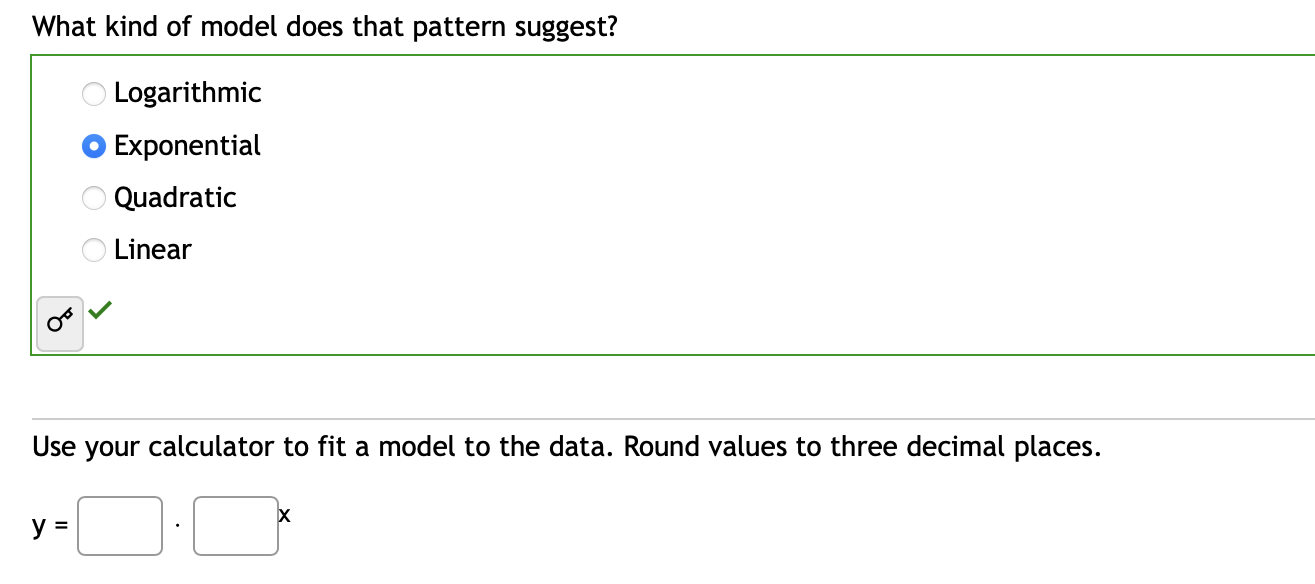
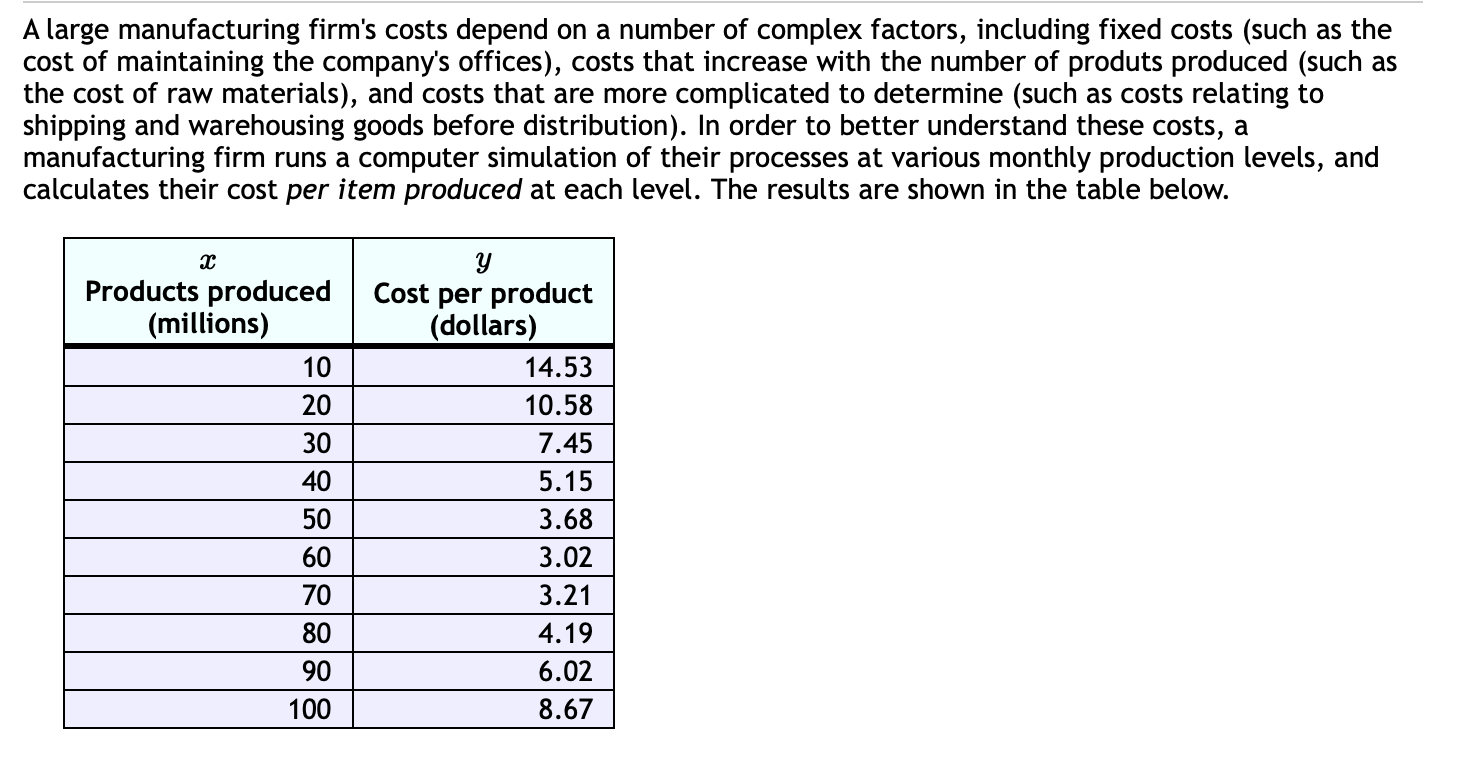
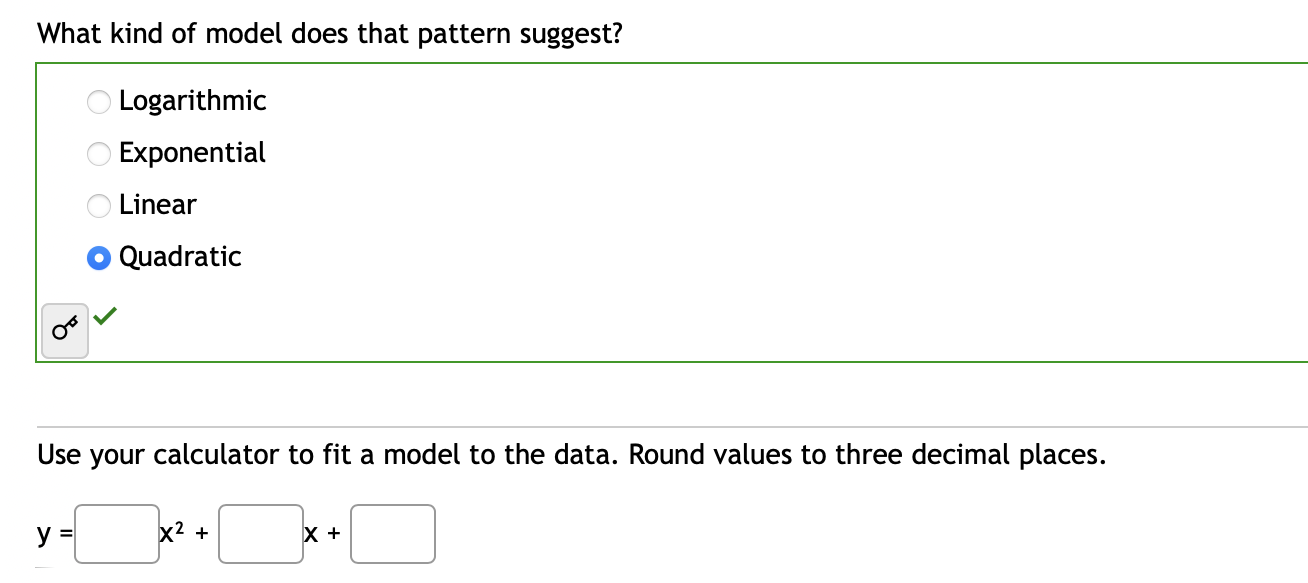
For each data table below, determine the best type of model to fit the data. Then, using your calculator or bj hand, find an expression for the function shown. Round values in your expression to the nearest integer: This function is Select an answer This function is Select an answer \"Ed Select an answer linear quadratic exponential logarithmic This function is Select an answer a This function is Select an answer a This function is Select an answer a Scientists notice that the diameter of a tree near the ground can be used to predict the tree's height. In order to make this prediction, they measure the heights and diameters of 15 trees of a certain species in a certain forest. Their measurements are shown in the data table below. m 3; Diameter of tree Height of tree (centimeters) (meters) 10.2 _\\ _\\ L400\": N ~D Who (.11 '4 What kind of model does that pattern suggest? O Logarithmic Linear O Exponential O Quadratic Part 3 of 5 Use your calculator to fit a model to the data. Round values to three decimal places. y = X +A study of high school students set out to determine how the number of hours a student works at a part-time job affects their GPA. 15 randomly selected high school seniors reported the number of hours they work each week and their GPA on their most recent report card (on a 4.0 scale). The results are shown in the table below. y Hours worked GPA 14 2.4 7 3.1 9 2.2 20 1.7 15 1.7 10 2.6 15 2.5 12 1.9 6 3.9 12 2.5 15 1.1 13 2.4 15 1.9 11 1.8 8 2.5What kind of model does that pattern suggest? Exponential 0 Linear Quadratic Logarithmic 05 Part30f5 Use your calculator to fit a model to the data. Round values to three decimal places. v=Q+D As children's brains mature, they grow to their eventual adult size. As part of a study, a child's brain is measured at various ages throughout childhood, and again when they have reached adulthood. The table below shows the size of the child's brain at various ages, and the size of their brain as an adult. II-\"lln y: Percent of adult 31 71 82 92 brain Size (percent) What kind of model does that pattern suggest? O Logarithmic O Exponential O Quadratic O Linear Part 3 of 5 Use your calculator to fit a model to the data. Round values to three decimal places. y = In(x)When a new technology comes to market, it is first used by early adopters and then spreads to the population at large, eventually becoming widespread. The table below shows the number of users of a technology various numbers of years after it was first introduced. x: Time (years) 1 2 3 4 5 y: Number of users 600 5280 3160 13130 16830What kind of model does that pattern suggest? O Logarithmic Exponential O Quadratic O Linear Use your calculator to fit a model to the data. Round values to three decimal places. V = XAluminum containers can be recycled indefinitely, as long as they are presented for recycling. An environmental scientist uses a computer simulation to study how much aluminum is recycled over time. the results, with a certain set of parameters, are shown in the table below. 3; Amount of aluminum still in circulation (tons) a: Time (months) What kind of model does that pattern suggest? O Logarithmic Exponential O Quadratic O Linear Use your calculator to fit a model to the data. Round values to three decimal places. y = XA large manufacturing firm's costs depend on a number of complex factors, including fixed costs (such as the cost of maintaining the company's offices), costs that increase with the number of produts produced (such as the cost of raw materials), and costs that are more complicated to determine (such as costs relating to shipping and warehousing goods before distribution). In order to better understand these costs a I manufacturing firm runs a computer simulation of their processes at various monthly production levels, and calculates their cost per item produced at each level. The results are shown in the table below. Products produced Cost per yproduct (millions) (dollars) What kind of model does that pattern suggest? O Logarithmic O Exponential O Linear Quadratic Use your calculator to fit a model to the data. Round values to three decimal places. y X2 + X +
Step by Step Solution
There are 3 Steps involved in it
1 Expert Approved Answer
Step: 1 Unlock
Question Has Been Solved by an Expert!
Get step-by-step solutions from verified subject matter experts
Step: 2 Unlock
Step: 3 Unlock
Students Have Also Explored These Related Mathematics Questions!