

Question: 1. For the data 6, 12, 8, 9, 11, 7, 7, 10, 11, find the mean of the data, then fill in the table.
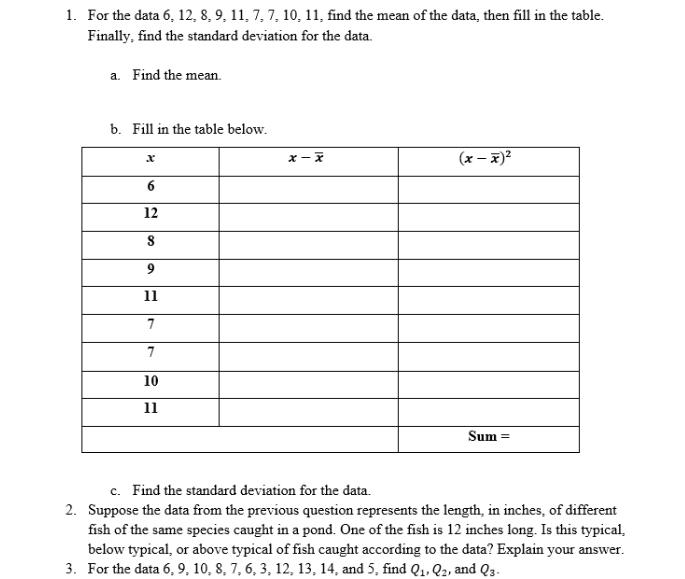

1. For the data 6, 12, 8, 9, 11, 7, 7, 10, 11, find the mean of the data, then fill in the table. Finally, find the standard deviation for the data. a. Find the mean. b. Fill in the table below. x 6 12 S 9 11 7 7 10 11 (x-x) Sum = c. Find the standard deviation for the data. 2. Suppose the data from the previous question represents the length, in inches, of different fish of the same species caught in a pond. One of the fish is 12 inches long. Is this typical, below typical, or above typical of fish caught according to the data? Explain your answer. 3. For the data 6, 9, 10, 8, 7, 6, 3, 12, 13, 14, and 5, find Q1, Q2, and Q3- 4. The interquartile range for the data is:
Step by Step Solution
There are 3 Steps involved in it

Get step-by-step solutions from verified subject matter experts