

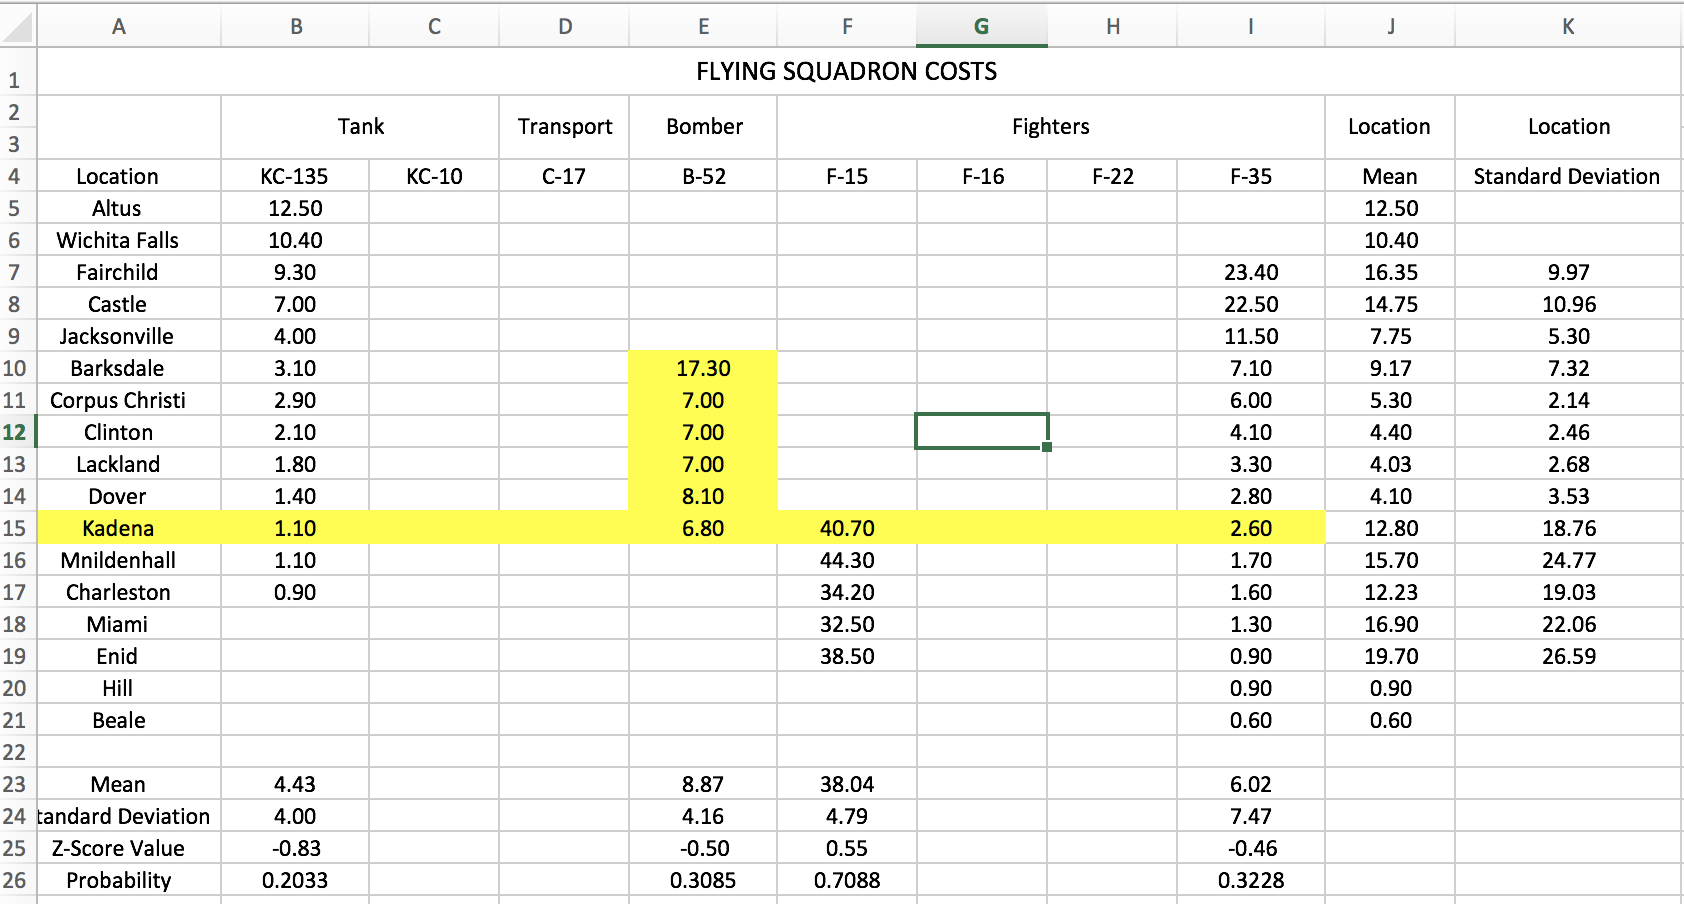
Question: Do these costs appear to come from a population that has a normal distribution? Why or why not? Can the mean of your data sample
- Do these costs appear to come from a population that has a normal distribution? Why or why not?
- Can the mean of your data sample be treated as a value from a population having a normal distribution? Why or why not?
- Did an "unusually low" or "unusually high" z-score value occur?
- Was the associated z score probability value less than 0.05 (p
- What were your findings? Hint: focus on the calculated mean, standard deviation and z-score (include probability) to interpret your results.
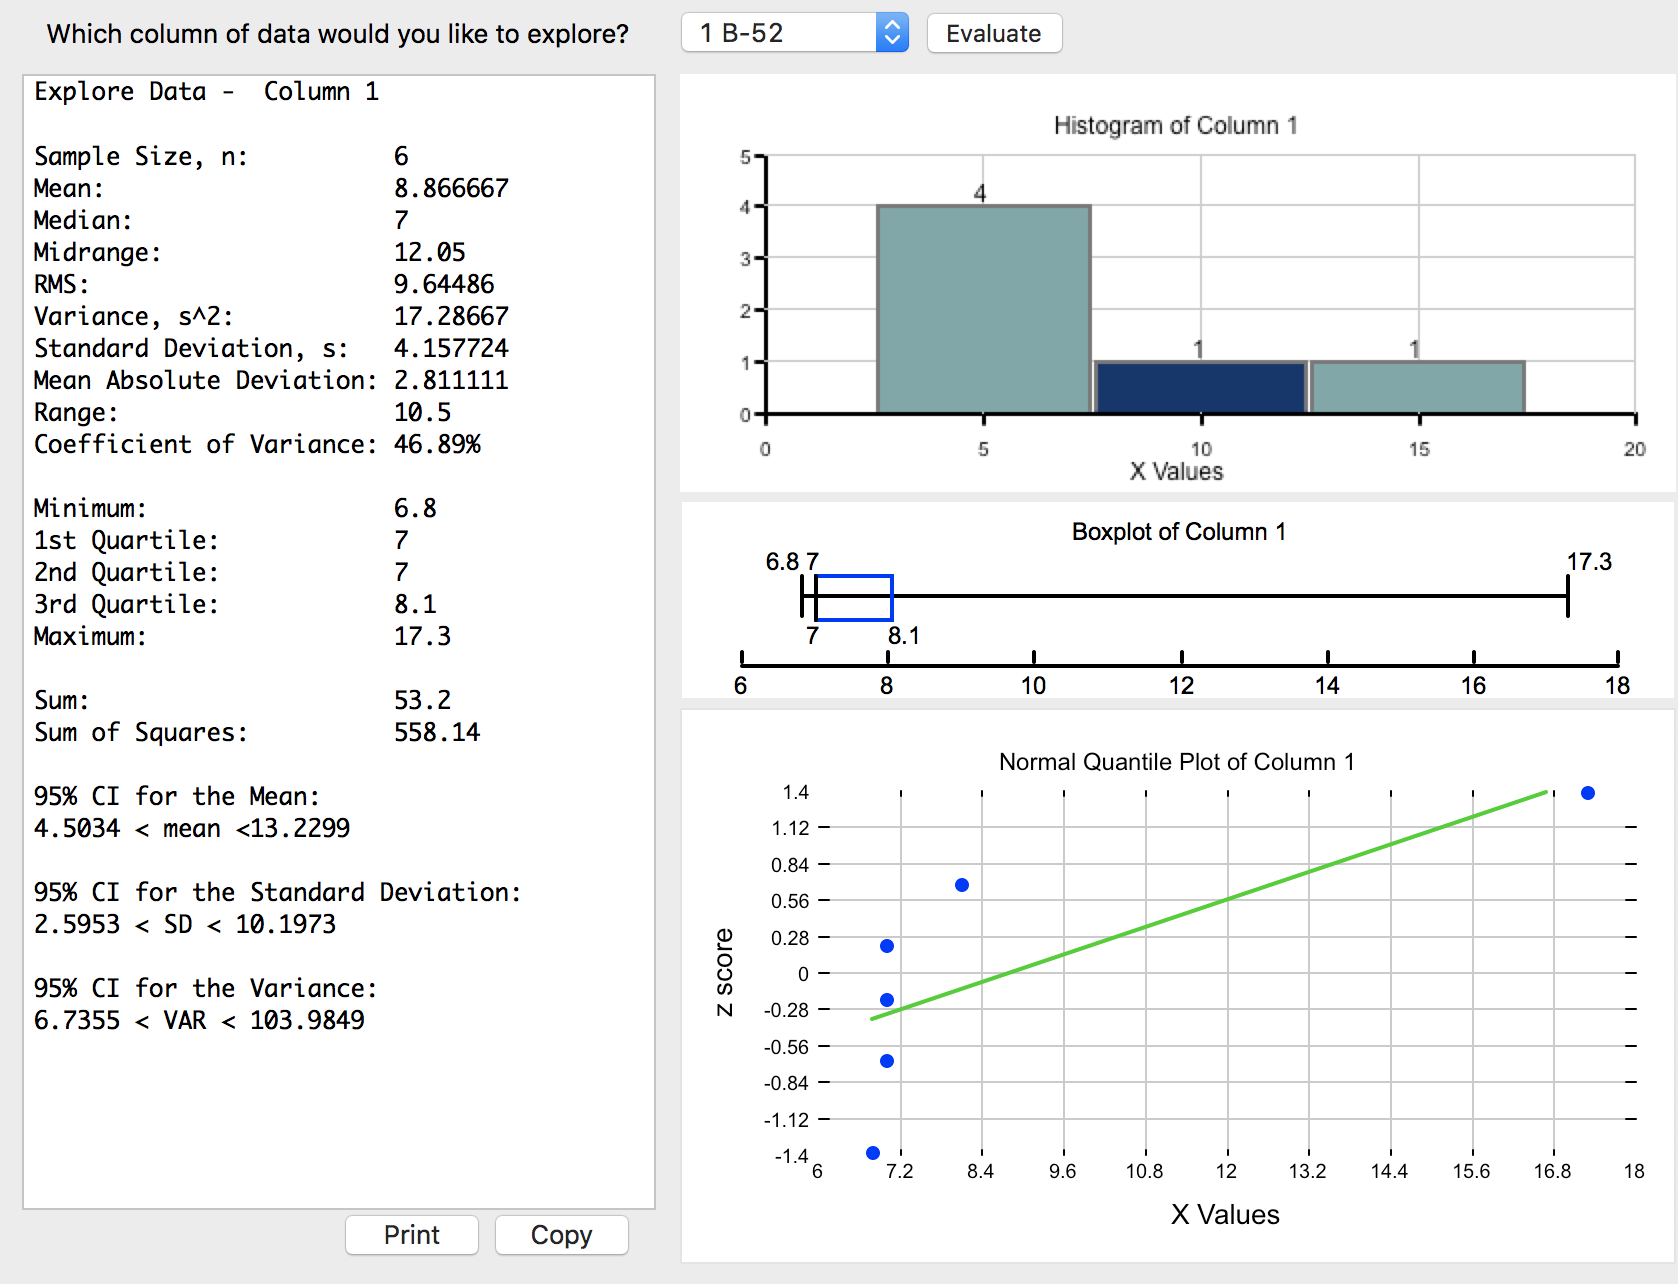
Which column of data would you like to explore? 1 B-52 Evaluate Explore Data - Column 1 Histogram of Column 1 Sample Size, n: 6 Mean : 8. 866667 Median: 7 Midrange: 12 . 05 RMS: 9. 64486 Variance, S^2: 17 . 28667 2- Standard Deviation, s: 4. 157724 Mean Absolute Deviation: 2. 811111 Range: 10.5 -0 Coefficient of Variance: 46. 89% 5 10 X Values 15 20 Minimum: 6.8 1st Quartile: 7 Boxplot of Column 1 2nd Quartile: 7 6.8 7 17.3 3rd Quartile: 8.1 Maximum : 17.3 7 8.1 Sum: 53 . 2 6 8 10 12 14 16 18 Sum of Squares: 558. 14 Normal Quantile Plot of Column 1 95%% CI for the Mean: 1.4 4. 5034
Step by Step Solution
There are 3 Steps involved in it
1 Expert Approved Answer
Step: 1 Unlock

Question Has Been Solved by an Expert!
Get step-by-step solutions from verified subject matter experts
Step: 2 Unlock
Step: 3 Unlock