

Question: 1. For the graph, interpret what the graph is telling us about happiness and ecological footprint, as described above. 2. Provide a range (minimum to
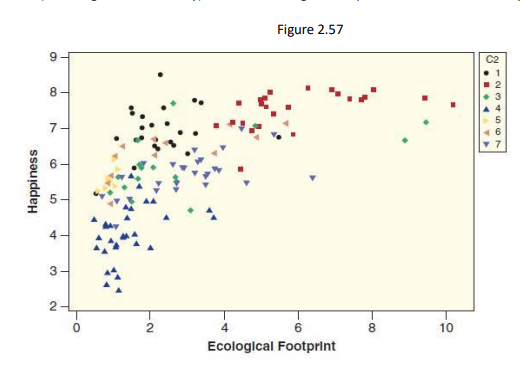
1. For the graph, interpret what the graph is telling us about happiness and ecological footprint, as described above. 2. Provide a range (minimum to maximum value), with a width no more than 0.2, for where you think the correlation statistic falls and support your decision with an explanation of the data points you see. 3. What could affect the size of the correlation statistic? a. In regard to the actual data points (hint: what are we assuming about the data?) b. In regard to how the variables were measured (i.e., what information is used to define them, as well as other potential information not considered?)
Step by Step Solution
There are 3 Steps involved in it
1 Expert Approved Answer
Step: 1 Unlock

Question Has Been Solved by an Expert!
Get step-by-step solutions from verified subject matter experts
Step: 2 Unlock
Step: 3 Unlock