

Question: For the graph, interpret what the graph is telling us about happiness and ecological footprint, as described above. Estimate and provide a range (minimum to
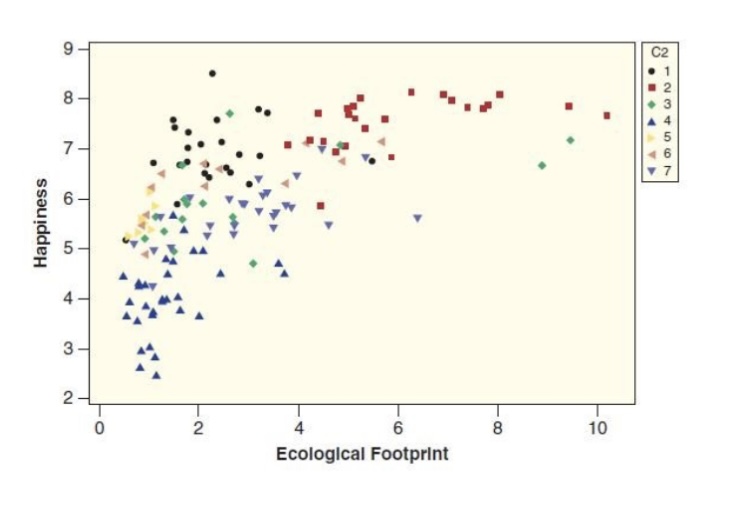
- For the graph, interpret what the graph is telling us about happiness and ecological footprint, as described above.
- Estimate and provide a range (minimum to maximum value), with a width no more than 0.2, for where you think the correlation statistic falls and support your decision with an explanation of the data points you see. Note: You are being asked to estimate the correlation statistic, you do not have to calculate the exact value.
- What could affect the size of the correlation statistic?
- In regard to the actual data points (hint: what are we assuming about the data?)
- In regard to how the variables were measured (i.e., what information is used to define them, as well as other potential information not considered?)
Step by Step Solution
There are 3 Steps involved in it
1 Expert Approved Answer
Step: 1 Unlock

Question Has Been Solved by an Expert!
Get step-by-step solutions from verified subject matter experts
Step: 2 Unlock
Step: 3 Unlock