

Question: 1. For the provided sample mean, sample size, and population standard deviation, complete parts (a) through (c) below. Assume that x is normally distributed. i=21,n=16,o=4
1.
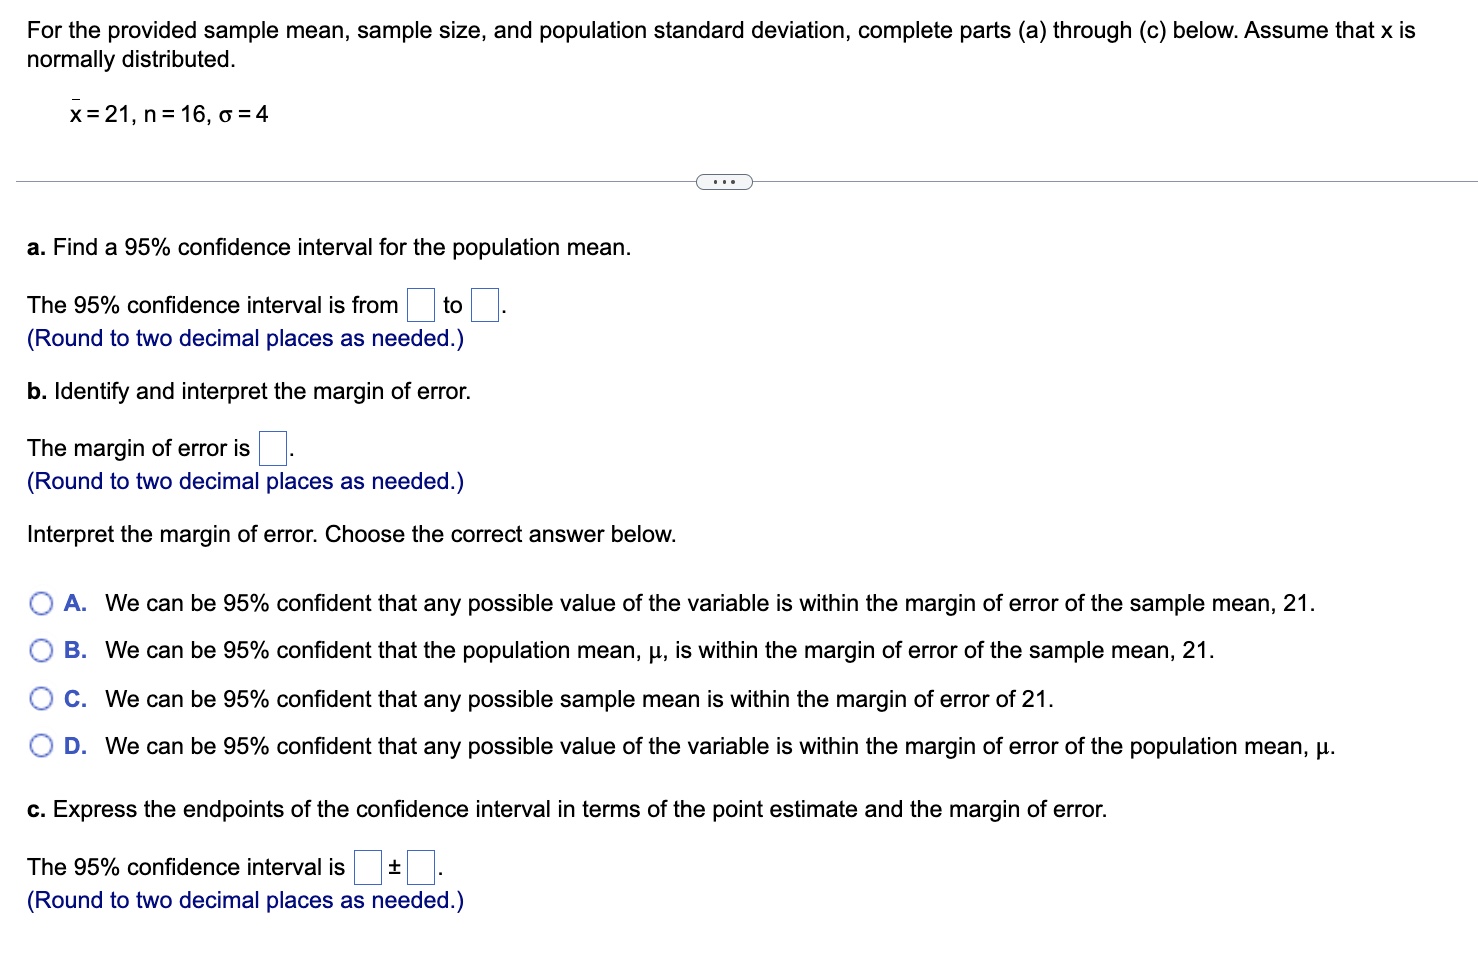
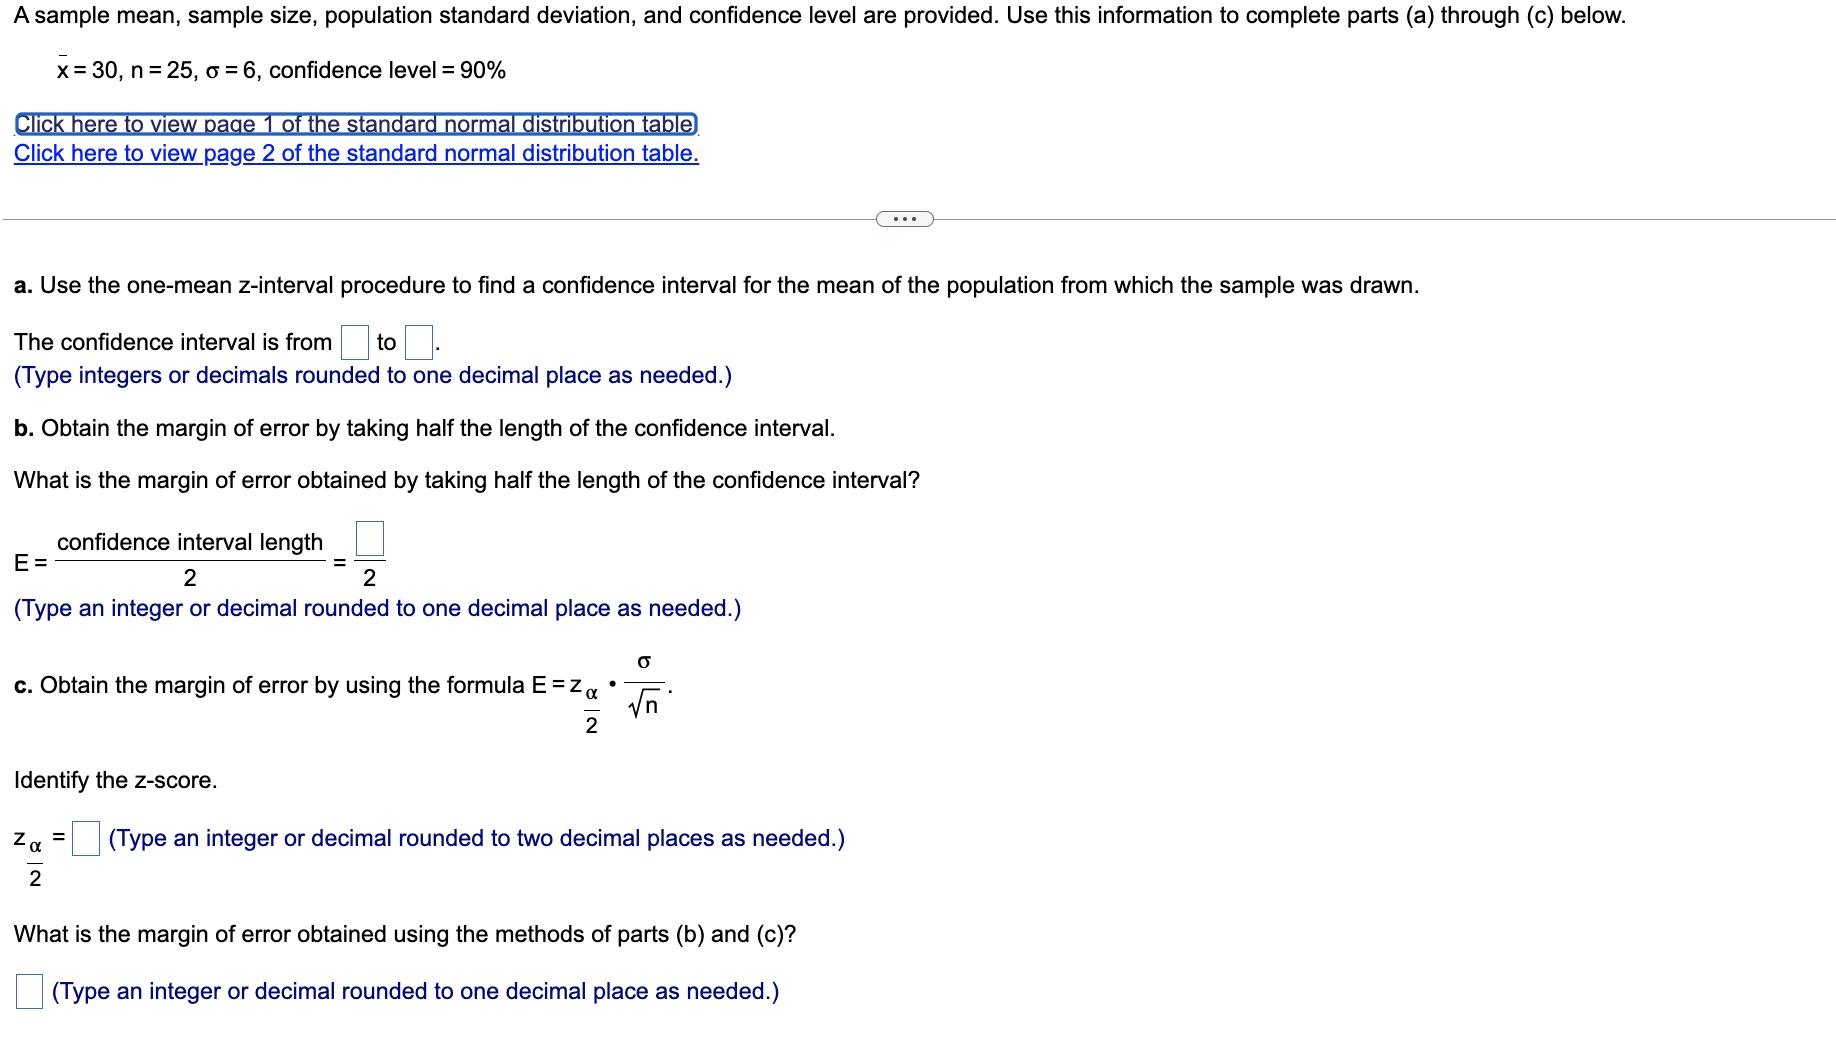
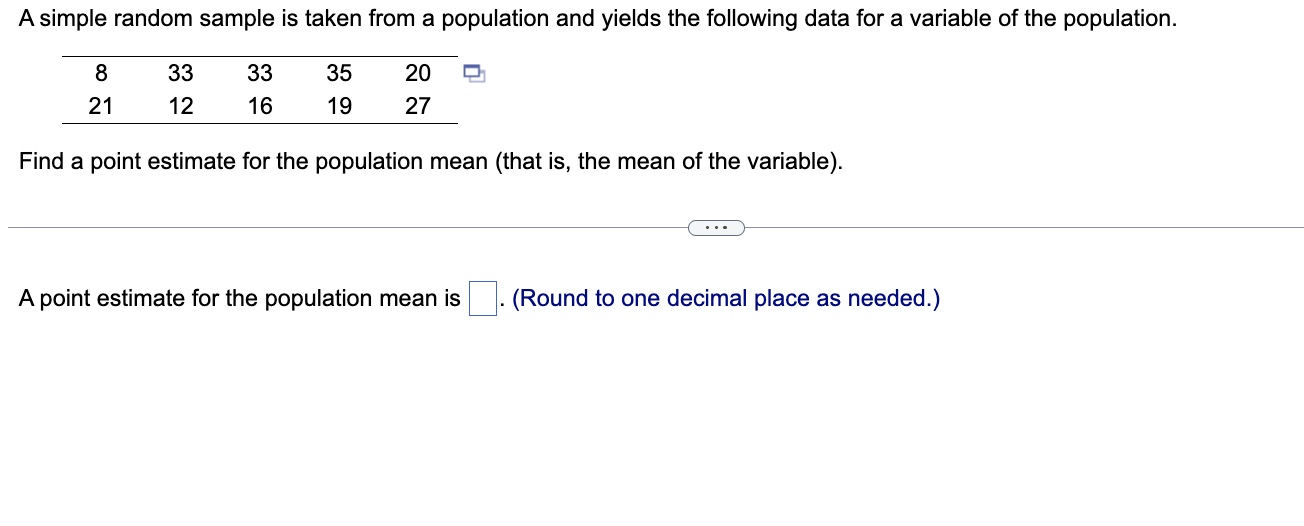
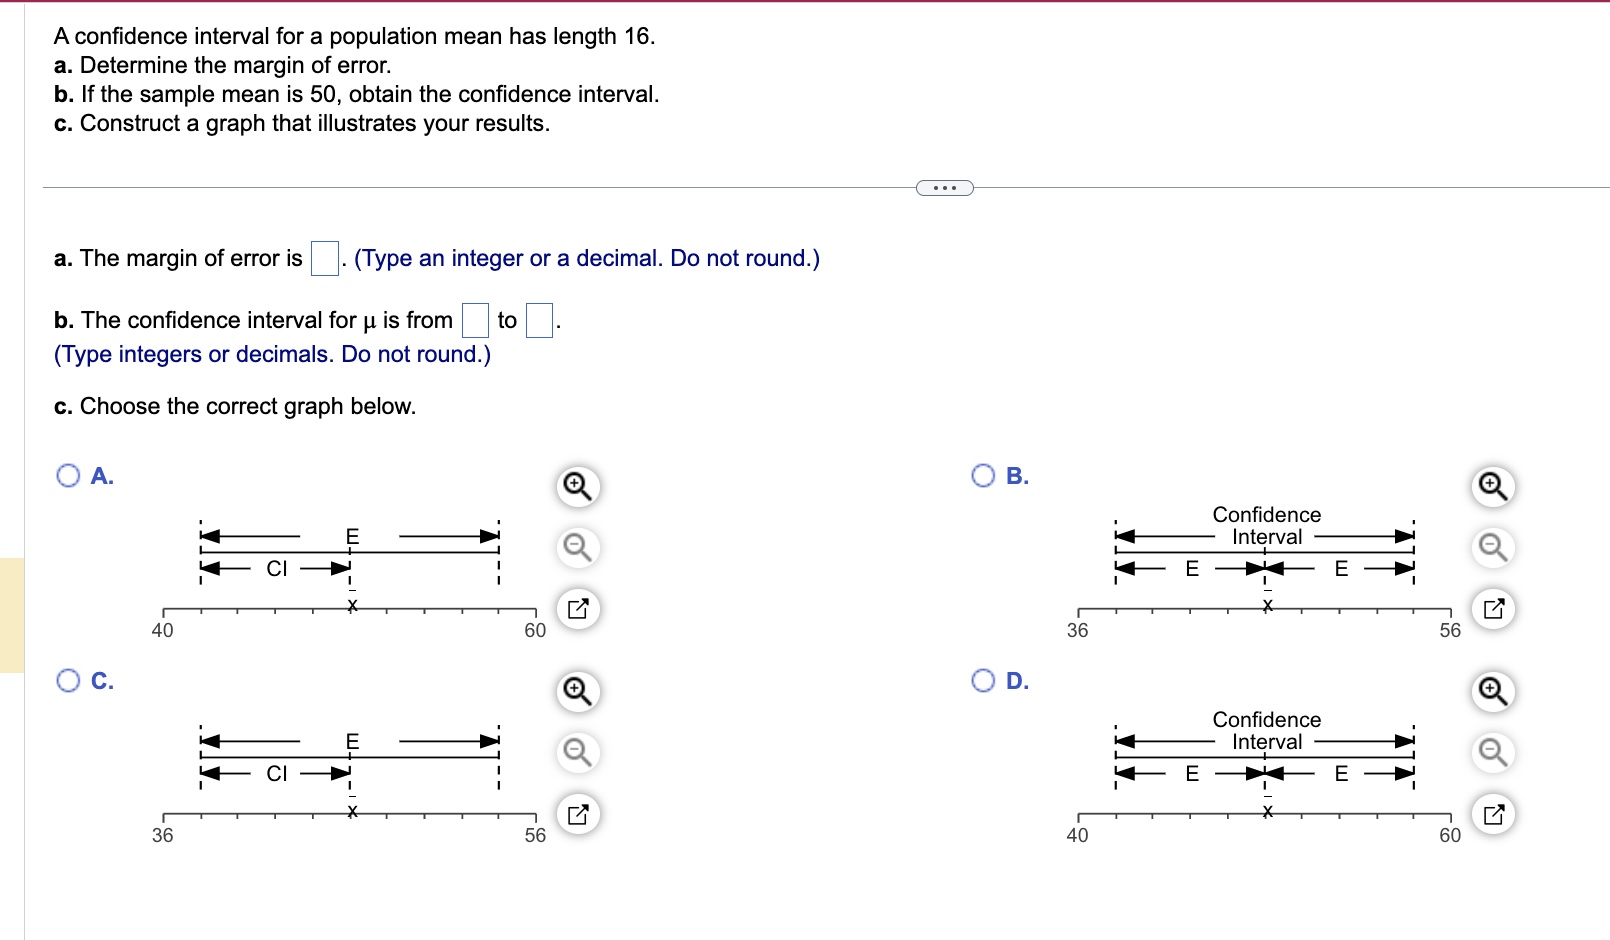
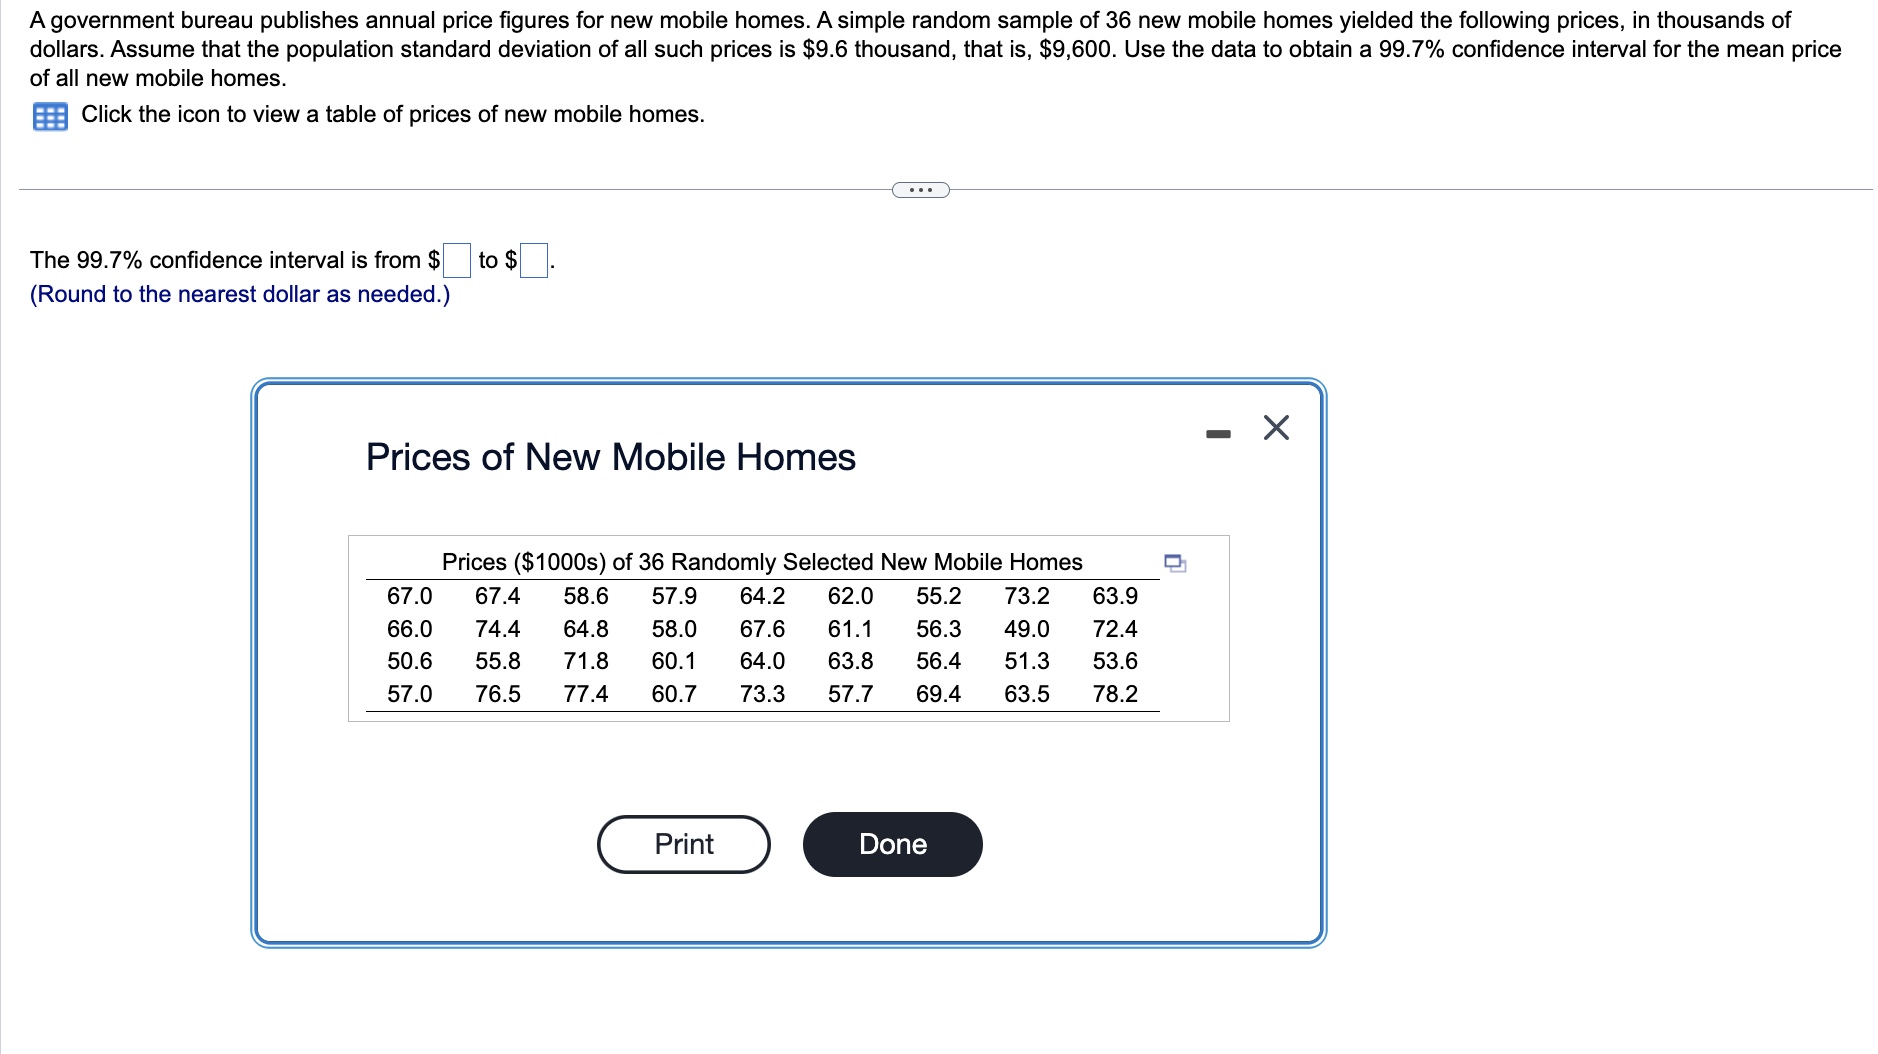
For the provided sample mean, sample size, and population standard deviation, complete parts (a) through (c) below. Assume that x is normally distributed. i=21,n=16,o=4 a. Find a 95% condence interval for the population mean. The 95% confidence interval is from to (Round to two decimal places as needed.) b. Identify and interpret the margin of error. The margin of error is . (Round to two decimal places as needed.) Interpret the margin of error. Choose the correct answer below. . We can be 95% condent that any possible value of the variable is within the margin of error of the sample mean, 21. A ' i B. We can be 95% condent that the population mean, p, is within the margin of error of the sample mean, 21. C. We can be 95% condent that any possible sample mean is within the margin of error of 21. D . We can be 95% condent that any possible value of the variable is within the margin of error of the population mean, p. c. Express the endpoints of the confidence interval in terms of the point estimate and the margin of error. The 95% confidence interval is i . (Round to two decimal places as needed.) A sample mean, sample size, population standard deviation, and confidence level are provided. Use this information to complete parts (a) through (c) below. R: 30, n = 25, c = 6, confidence level = 90% ummmmmiimmmmnmmmmmm Click here to view p_age 2 of the standard normal distribution table. a. Use the one-mean z-interval procedure to nd a confidence interval for the mean of the population from which the sample was drawn. The condence interval is from to . (Type integers or decimals rounded to one decimal place as needed.) b. Obtain the margin of error by taking half the length of the confidence interval. What is the margin of error obtained by taking half the length of the confidence interval? confidence interval length E = f = 7 (Type an integer or decimal rounded to one decimal place as needed.) c c. Obtain the margin oferror by using the formula E =Zu - 4. n 2 Identify the zscore. z a = (Type an integer or decimal rounded to two decimal places as needed.) 2 What is the margin of error obtained using the methods of parts (b) and (c)? (Type an integer or decimal rounded to one decimal place as needed.) A simple random sample is taken from a population and yields the following data for a variable of the population. 8 33 33 35 20 El 21 12 16 19 27 Find a point estimate for the population mean (that is, the mean of the variable). A point estimate for the population mean is . (Round to one decimal place as needed.) A confidence interval for a population mean has length 16. a. Determine the margin of error. b. If the sample mean is 50, obtain the confidence interval. c. Construct a graph that illustrates your results. . . . a. The margin of error is . (Type an integer or a decimal. Do not round.) b. The confidence interval for u is from to (Type integers or decimals. Do not round.) c. Choose the correct graph below. O A. O B. Confidence E Interval CI E E Z 40 60 36 56 O c. + O D. Confidence -m Interval CI E E 36 56 40 60A government bureau publishes annual price figures for new mobile homes. A simple random sample of 36 new mobile homes yielded the following prices, in thousands of dollars. Assume that the population standard deviation of all such prices is $9.6 thousand, that is, $9,600. Use the data to obtain a 99.7% confidence interval for the mean price of all new mobile homes. Click the icon to view a table of prices of new mobile homes. The 99.7% confidence interval is from $ to $ (Round to the nearest dollar as needed.) - X Prices of New Mobile Homes Prices ($1000s) of 36 Randomly Selected New Mobile Homes 67.0 67.4 58.6 57.9 64.2 62.0 55.2 73.2 63.9 66.0 74.4 64.8 58.0 67.6 61.1 56.3 49.0 72.4 50.6 55.8 71.8 60.1 64.0 63.8 56.4 51.3 53.6 57.0 76.5 77.4 60.7 73.3 57.7 69.4 63.5 78.2 Print Done
Step by Step Solution
There are 3 Steps involved in it

Get step-by-step solutions from verified subject matter experts